MATLAB运动学之蒙特卡罗法求积分与机器人工作域分析
蒙特卡罗法又叫做统计模拟法、随机抽样技术,是一种随机模拟方法以概率和统计理论方法为基础的一种计算方法,通俗来说是可以使用随机数来解决很多计算问题的一种方法,很直观简单,尤其对于一些求解积分无解的情况,非常好使且简单粗暴。
蒙特卡罗法求面积(定积分)
以 y = x2 为例,我们需要求出 x 在[0,10]相对应的 y 在[0,100] 所围成的曲线面积,在我们有了微积分的知识之后,我们可以通过对这个函数的原函数做差来求解(1/3*103-1/3*03=1000/3),这种叫做解析解,也就是通过数学公式求出来的解。
除了这种求积分的方法,我们接下来介绍的就是蒙特卡罗法。
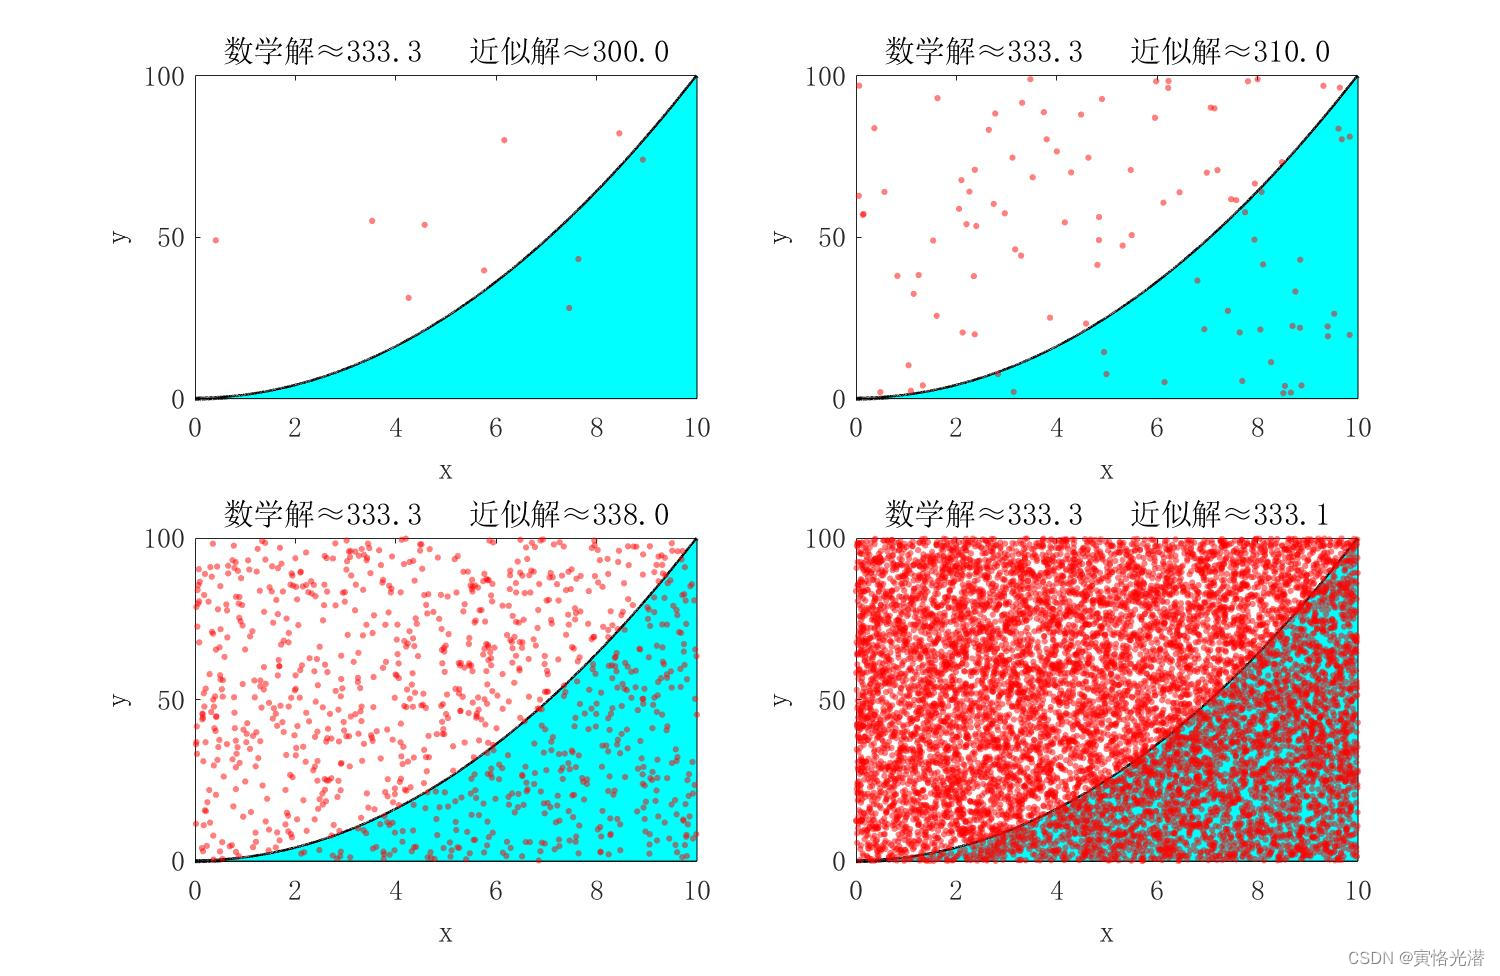
将大量随机点散落到整个矩形,然后计算散落在围成曲线下的点的数量的占比就可以得出曲线面积了。
曲线围成的面积=整个矩形区间的面积 * 曲线下方的点的个数的占比
需要注意的是,蒙特卡罗法的前提条件是区间的值要么全是正值,要么全是负值,如果不是的情况就分区再求积分。?
是不是有了这方法,不管什么曲线围成的面积,都不在话下,就这么简单粗暴好用哈哈。
%使用非负整数 seed 为随机数生成函数提供种子,以使 rand、randi 和 randn 生成可预测的数字序列。
rng(0);
set(0,'defaultAxesFontName', 'Monospaced');  % 防止中文乱码
set(gcf, 'position', [10, 20, 1000, 700]);
%f = suptitle('求解y=x^2定积分');
%set(f, 'fontsize', 20);
L = 10;  % 积分区间长度
fs = 1 / 1e3; % 采样率0.001
x = 0 : fs : L;
y = x .^ 2;
S = L * (L ^ 2);  %矩形面积,这个示例就是1000

% 随机点的数量(作对比)
N_Lis = [10, 100, 1000, 10000];

% 解析解(原函数做差值)
res_integ = 1/3 * (10^3 - 0^3);

% 近似解
%figure(1); clf;
for n = 1 : length(N_Lis)
    cnt = 0;
    x_random = L * rand(1, N_Lis(n));  % 随机点x
    y_random = L ^ 2 * rand(1, N_Lis(n));  % 随机点y
    % 统计曲线下面的点的数量
    for i = 1 : N_Lis(n)
        if y_random(i) <= x_random(i) ^ 2
            cnt = cnt + 1;
        end
    end
    res_appro = cnt / N_Lis(n) * S;
    % 画图对比
    subplot(2, 2, n);
    plot(x, y, 'k', 'linewidth', 2); hold on;
    area(x, y, 'facecolor','c'); hold on;
    scatter(x_random, y_random, 10, 'r', 'filled', 'markerfacealpha', 0.5);
    xlabel('x'); ylabel('y'); set(gca, 'fontsize', 14);
    title(['数学解≈', num2str(res_integ, '%.1f'), '   近似解≈', num2str(res_appro, '%.1f')]);
end
可以看到当随机点从10个增加到10000个的时候,结果对比也可以知道,求出来的这个近似解就越接近解析解(真实值),那么我们在生活当中如果遇到需要求面积的情况,而且连曲线的函数都不清楚的情况下,我们应该知道如何求曲线围成的面积了,比如说,可以撒上一层豆子或者是水,水是最好的(连续,不离散),然后称量下曲线围成的豆子或者水的重量在整个矩形中的占比就可以知道围成的面积了。
无解的情况
有时候求积分是无解的情况,比如下面的三个函数所围成的面积,我们就不能通过数学公式得到解析解或者说非常困难,但是可以快速使用蒙特卡罗法来求其近似解:?
T = 20;
fs = 1 / 1e3;
x0 = -T : fs : T;
y1 = sin(x0.^ 2);
y2 = sin(x0) ./ x0;
y3 = exp(-x0.^2);

figure(1); clf;
subplot(3, 1, 1);
plot(x0, y1, 'linewidth', 1.5); ylabel('y'); title('y=sin(x^2)'); set(gca, 'fontsize', 12);
subplot(3, 1, 2);
plot(x0, y2, 'linewidth', 1.5); ylabel('y'); title('y=sin(x)/x'); set(gca, 'fontsize', 12);
subplot(3, 1, 3);
plot(x0, y3, 'linewidth', 1.5); xlabel('x'); ylabel('y'); title('y=e^{-x^2}'); set(gca, 'fontsize', 12);

% 绘制围成区域
x = 0 : fs : 2;
y11 = sin(x.^ 2);
y21 = sin(x) ./ x;
y31 = exp(-x.^2);

figure(2); clf;
plot(x, y11, 'linewidth', 1.5); hold on;
plot(x, y21, 'linewidth', 1.5); hold on;
plot(x, y31, 'linewidth', 1.5); hold on;
area(x(y11>y31 & y21>y11), y11(y11>y31 & y21>y11), 'facecolor', 'c', 'edgealpha', 0); hold on;
area(x(y11>y31 & y21>y11), y31(y11>y31 & y21>y11), 'facecolor', 'w', 'edgealpha', 0); hold on;
h = legend('y=sin(x^2)', 'y=sin(x)/x', 'y=e^{-x^2}', 'location', 'southwest');
xlabel('x'); ylabel('y'); title('求三条曲线围成的面积'); set(gca, 'fontsize', 12); set(h, 'fontsize', 12);

% 蒙特卡罗法求面积
L = 2;
H = 3;
S = L * H;
N_Lis = [1e1, 1e2, 1e3, 1e4];
figure(3); clf;
for n = 1 : length(N_Lis)
    N = N_Lis(n);
    x_random = L * rand(1, N);
    y_random = H * rand(1, N) - 1;
    cnt = 0;
    for i = 1 : N
        if (y_random(i) <= sin(x_random(i)^2)) && (y_random(i) <= sin(x_random(i))/x_random(i)) ...
                && (y_random(i) >= exp(-x_random(i)^2))
            cnt = cnt + 1;
        end
    end
    res_appro = cnt / N * S;

    subplot(2, 2, n);
    plot(x, y11, 'linewidth', 1.5); hold on;
    plot(x, y21, 'linewidth', 1.5); hold on;
    plot(x, y31, 'linewidth', 1.5); hold on;
    area(x(y11>y31 & y21>y11), y11(y11>y31 & y21>y11), 'facecolor', 'c', 'edgealpha', 0); hold on;
    area(x(y11>y31 & y21>y11), y31(y11>y31 & y21>y11), 'facecolor', 'w', 'edgealpha', 0); hold on;
    scatter(x_random, y_random, 10, 'r', 'filled', 'markerfacealpha', 0.5);
    xlabel('x'); ylabel('y'); title(['样本数=', num2str(N_Lis(n)), '   近似解≈', num2str(res_appro, '%.2f')]);
    set(gca, 'fontsize', 14);
end

h = suptitle('蒙特卡罗法求图形面积');
set(h, 'fontsize', 18);
set(gcf, 'position', [10, 20, 800, 700]);


 只需要将随机点(样本数)增加到基本覆盖整个区域,我们就可以得到所围成的图形里面的样本数的占比,这样就近似求出了这个所围成的面积了。
机器人工作区域
在机器人领域,我们也可以使用蒙特卡罗法模拟出末端执行器的运动区域,这样对于我们关注机器人的所能工作的范围有一个更直观的了解。
%定义D-H参数
a2 = 0.420;
a3 = 0.375;
d2 = 0.138 + 0.024;
d3 =-0.127 -0.024;
d4 = 0.114 + 0.021;
d5 = 0.114 + 0.021;
d6 = 0.090 + 0.021;

for i = 1:100000
%角度范围是[-pi,pi],rand返回(0,1) 内均匀分布的随机数
%模拟各关节的角度
theta1 = -pi + 2*pi*rand;
theta2 = 0 + 2*pi*rand;
theta3 =-(5/6)*pi + (5/3)*pi*rand;
theta4 = -pi + 2*pi*rand;
theta5 = -pi + 2*pi*rand;
theta6 = -pi + 2*pi*rand;

%XYZ就是关节的末端位置值(不考虑方向)
x(i) = a2*cos(theta1)*cos(theta2)+a3*cos(theta1)*cos(theta2+theta3)-d5*cos(theta1)*sin(theta2+theta3+theta4)-sin(theta1)*(d2+d3+d4)-d6*(cos(theta5)*sin(theta1)-cos(theta1)*cos(theta2+theta3+theta4)*sin(theta5));
01:46

y(i) = d6*(cos(theta1)*cos(theta5)+cos(theta2+theta3+theta4)*sin(theta1)*sin(theta5))+a3*sin(theta1)*cos(theta2+theta3)-d5*sin(theta1)*sin(theta2+theta3+theta4)+cos(theta1)*(d2+d3+d4)+a2*cos(theta2)*sin(theta1);

z(i) =-a3*sin(theta2+theta3)-a2*sin(theta2)-d5*cos(theta2+theta3+theta4)-d6*sin(theta5)*sin(theta2+theta3+theta4);
end

plot3(x,y,z,'b.','MarkerSize',0.5)
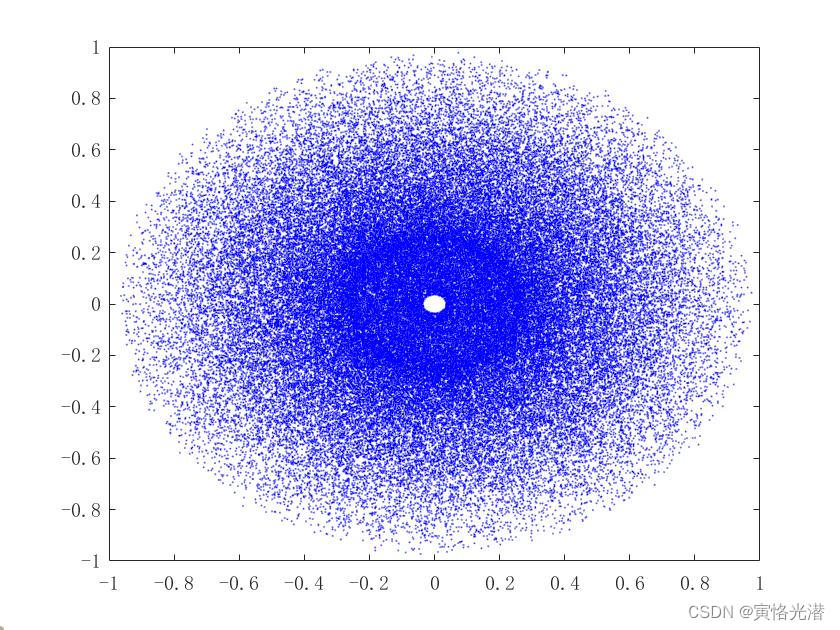
我们这里让机器人的关节随机运行10万次,也就是10万个随机点,通过plot3函数,画出这个六轴机械臂末端执行器所处空间的能够工作的范围了,基本上可以看到能够覆盖机器人所能够工作的区域了。
也可以观察XY组成的侧面,或者另外两根轴组成的侧面情况
 其中中间白色圆心部分,是机械臂末端所不能运动到的地方。
本文来自互联网用户投稿,该文观点仅代表作者本人,不代表本站立场。本站仅提供信息存储空间服务,不拥有所有权,不承担相关法律责任。 如若内容造成侵权/违法违规/事实不符,请联系我的编程经验分享网邮箱:veading@qq.com进行投诉反馈,一经查实,立即删除!