使用Python进行用户参与度分析
用户参与度分析是一种数据驱动的方法,用于评估和了解用户对产品,服务或平台的参与,互动和满意度。它涉及分析各种指标和行为模式,以深入了解用户行为和偏好。它帮助企业做出明智的决策,以增强用户体验,优化营销策略,并提高整体产品或服务性能。本文中,将带您完成使用Python进行用户参与度分析的任务。
用户参与度分析:概述
用户参与度分析有助于企业了解人们如何与他们的产品或服务互动,使他们能够做出改进,使用户更快乐,更有可能留下来。它可以帮助企业为客户创建更好的UI/UX,并最终实现他们的目标。
用户参与度分析可帮助各种类型的企业,包括电子商务、社交媒体、移动的应用程序和在线平台。例如,电子商务公司可以使用它来了解客户如何浏览他们的网站,他们喜欢什么产品,以及他们在每个页面上停留的时间。它可以帮助公司优化他们的网站设计,个性化的产品推荐,并改善营销策略,以提高客户满意度和忠诚度。
对于用户参与度分析,企业需要捕捉用户如何与其产品、服务或平台交互的数据。它包括用户访问网站或应用程序的次数,他们采取的操作(例如点击或购买),他们在页面或会话中停留的时间,或他们提供的任何反馈等信息。
使用Python进行用户参与度分析
现在,让我们通过导入必要的Python库和数据集来开始用户参与度分析的任务:
import pandas as pd
import plotly.express as px
import plotly.io as pio
import plotly.graph_objects as go
pio.templates.default = "plotly_white"

data = pd.read_csv("bounce rate.csv")
print(data.head())
输出
      Client ID  Sessions Avg. Session Duration Bounce Rate
0  5.778476e+08       367              00:01:35      87.19%
1  1.583822e+09       260              00:01:04      29.62%
2  1.030699e+09       237              00:00:02      99.16%
3  1.025030e+09       226              00:02:22      25.66%
4  1.469968e+09       216              00:01:23      46.76%
在继续之前,让我们先看看null值:
print(data.isnull().sum())
输出
Client ID                0
Sessions                 0
Avg. Session Duration    0
Bounce Rate              0
dtype: int64
看看数据的整体信息
print(data.info())
输出
<class 'pandas.core.frame.DataFrame'>
RangeIndex: 999 entries, 0 to 998
Data columns (total 4 columns):
 #   Column                 Non-Null Count  Dtype
---  ------                 --------------  -----
 0   Client ID              999 non-null    float64
 1   Sessions               999 non-null    int64
 2   Avg. Session Duration  999 non-null    object
 3   Bounce Rate            999 non-null    object
dtypes: float64(1), int64(1), object(2)
memory usage: 31.3+ KB
None
平均值会话持续时间和退回率列不是数字。我们需要将它们转换为适合此任务的数据类型。以下是我们如何准备数据:
data['Avg. Session Duration'] = data['Avg. Session Duration'].str[1:]
data['Avg. Session Duration'] = pd.to_timedelta(data['Avg. Session Duration'])
data['Avg. Session Duration'] = data['Avg. Session Duration'] / pd.Timedelta(minutes=1)
data['Bounce Rate'] = data['Bounce Rate'].str.rstrip('%').astype('float')
print(data)
输出
        Client ID  Sessions  Avg. Session Duration  Bounce Rate
0    5.778476e+08       367               1.583333        87.19
1    1.583822e+09       260               1.066667        29.62
2    1.030699e+09       237               0.033333        99.16
3    1.025030e+09       226               2.366667        25.66
4    1.469968e+09       216               1.383333        46.76
..            ...       ...                    ...          ...
994  1.049263e+09        17               7.733333        41.18
995  1.145806e+09        17               5.616667        47.06
996  1.153811e+09        17               0.200000        94.12
997  1.182133e+09        17               1.216667        88.24
998  1.184187e+09        17               2.566667        64.71

[999 rows x 4 columns]
在上面的代码中,我们删除了“Avg. Session Duration”中每个值的第一个字符。然后,我们将“Avg.Session Duration”列转换为标准化的时间增量格式,表示持续时间。然后,我们进一步将时间增量值转换为分钟,以数字格式提供平均会话持续时间。同样,我们从“Bounce Rate”列中的每个值中删除了百分比符号,并将其转换为浮点值,以小数表示跳出率。
现在让我们来看看数据的描述性统计:
print(data.describe())
输出
          Client ID    Sessions  Avg. Session Duration  Bounce Rate
count  9.990000e+02  999.000000             999.000000   999.000000
mean   1.036401e+09   32.259259               3.636520    65.307978
std    6.151503e+08   24.658588               4.040562    22.997270
min    1.849182e+05   17.000000               0.000000     4.880000
25%    4.801824e+08   21.000000               0.891667    47.370000
50%    1.029507e+09   25.000000               2.466667    66.670000
75%    1.587982e+09   35.000000               4.816667    85.190000
max    2.063338e+09  367.000000              30.666667   100.000000
现在让我们在继续之前先看看相关矩阵:
# Exclude 'Client Id' column from the dataset
data_without_id = data.drop('Client ID', axis=1)

# Calculate the correlation matrix
correlation_matrix = data_without_id.corr()

# Visualize the correlation matrix
correlation_fig = px.imshow(correlation_matrix,
                            labels=dict(x='Features',
                                        y='Features',
                                        color='Correlation'))
correlation_fig.update_layout(title='Correlation Matrix')
correlation_fig.show()

分析跳出率
让我们分析用户的跳出率来了解用户参与度。跳出率是指访问网站或网页但没有采取任何进一步行动或导航到同一网站内的其他页面而离开的用户的百分比。简单地说,它衡量的是访问者从网站跳出的速度。
它是用户参与度分析中的一个有用指标,因为它提供了对用户行为的洞察以及网站或网页在捕捉和保持用户兴趣方面的有效性。高跳出率通常表明用户在网站上没有找到他们期望或想要的东西。它可能会提示用户体验差、内容不相关、页面加载速度慢或误导性营销活动等问题。以下是如何通过分析用户的跳出率来分析用户参与度:
# Define the thresholds for high, medium, and low bounce rates
high_bounce_rate_threshold = 70
low_bounce_rate_threshold = 30

# Segment the clients based on bounce rates
data['Bounce Rate Segment'] = pd.cut(data['Bounce Rate'],
                                     bins=[0, low_bounce_rate_threshold,
                                           high_bounce_rate_threshold, 100],
                                   labels=['Low', 'Medium', 'High'], right=False)

# Count the number of clients in each segment
segment_counts = data['Bounce Rate Segment'].value_counts().sort_index()

# Visualize the segments
segment_fig = px.bar(segment_counts, labels={'index': 'Bounce Rate Segment',
                                             'value': 'Number of Clients'},
                     title='Segmentation of Clients based on Bounce Rates')
segment_fig.show()
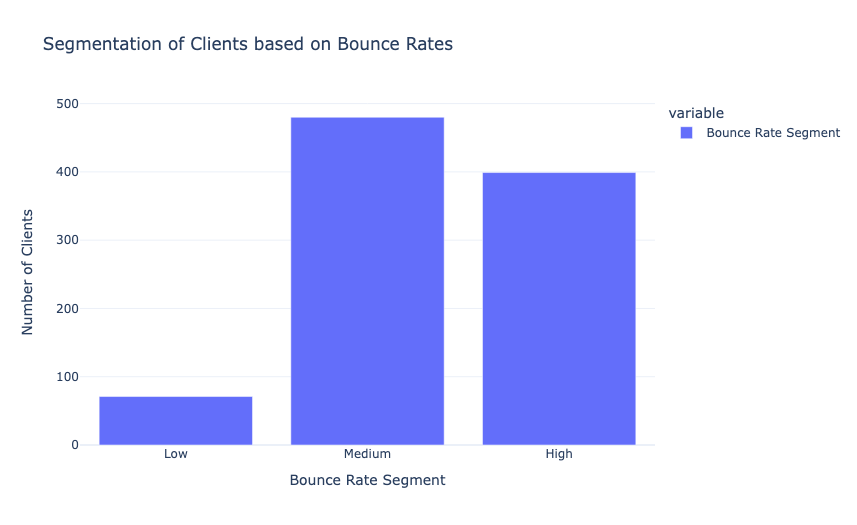
我们在上面的代码中创建了跳出率段,并分析了每个段中的用户数量。现在让我们来看看每个跳出率段中用户的平均会话持续时间:
# Calculate the average session duration for each segment
segment_avg_duration = data.groupby('Bounce Rate Segment')['Avg. Session Duration'].mean()

# Create a bar chart to compare user engagement
engagement_fig = go.Figure(data=go.Bar(
    x=segment_avg_duration.index,
    y=segment_avg_duration,
    text=segment_avg_duration.round(2),
    textposition='auto',
    marker=dict(color=['#2ECC40', '#FFDC00', '#FF4136'])
))

engagement_fig.update_layout(
    title='Comparison of User Engagement by Bounce Rate Segment',
    xaxis=dict(title='Bounce Rate Segment'),
    yaxis=dict(title='Average Session Duration (minutes)'),
)

engagement_fig.show()
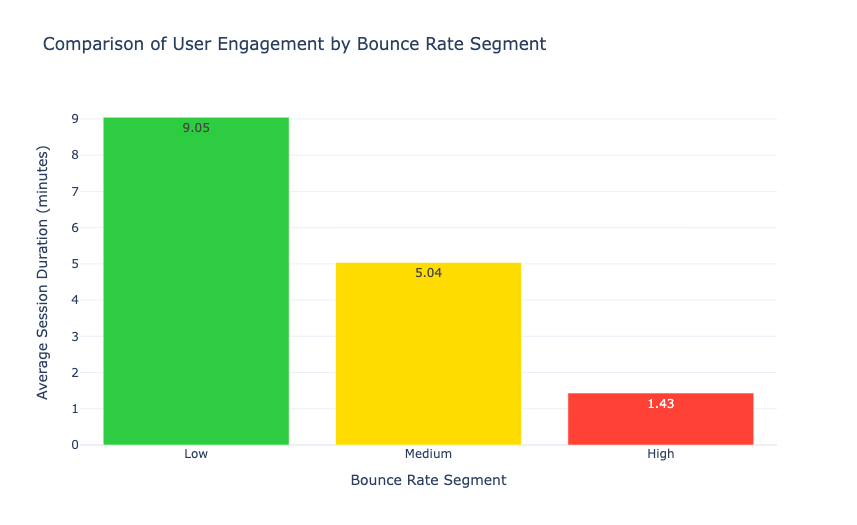
因此我们可以看到,跳出率低的用户在网站上的平均会话持续时间约为9.05分钟,而跳出率高的用户的平均会话持续时间仅为1.43分钟。
现在让我们来看看根据会话数量和平均会话持续时间排名前10的忠实用户:
# Calculate the total session duration for each client
data['Total Session Duration'] = data['Sessions'] * data['Avg. Session Duration']

# Sort the DataFrame by the total session duration in descending order
df_sorted = data.sort_values('Total Session Duration', ascending=False)

# the top 10 most loyal users
df_sorted.head(10)
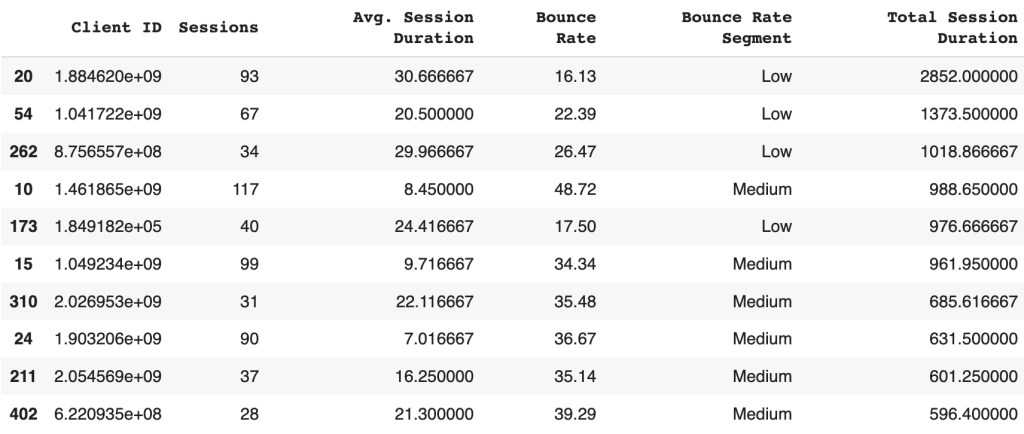
现在让我们来看看平均会话持续时间和跳出率之间的关系:
# Create a scatter plot to analyze the relationship between bounce rate and avg session duration
scatter_fig = px.scatter(data, x='Bounce Rate', y='Avg. Session Duration',
                         title='Relationship between Bounce Rate and Avg. Session Duration', trendline='ols')

scatter_fig.update_layout(
    xaxis=dict(title='Bounce Rate'),
    yaxis=dict(title='Avg. Session Duration')
)

scatter_fig.show()
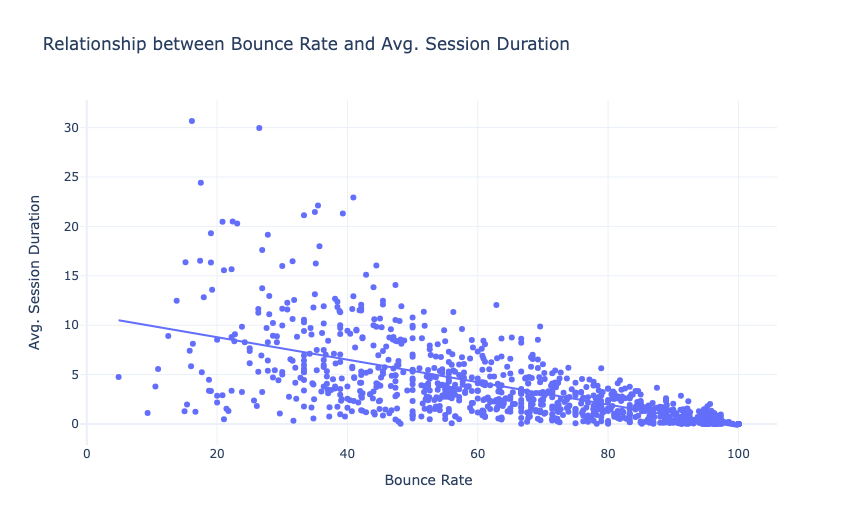
因此,平均会话持续时间和跳出率之间存在负线性关系(这里是理想的)。这意味着大量的平均会话持续时间会导致较低的跳出率。
分析用户留存
现在,让我们通过计算平台迄今为止保留的用户数量来分析用户参与度。留存用户是指在特定时间内继续使用或参与产品、服务或平台的个人。他们是在初次互动或注册后返回并保持活跃或忠诚的用户。
留存用户表现出持续的参与,重复使用或与产品持续互动,表明满意度或从产品或服务中获得的价值。企业通常专注于留住用户,以推动增长,提高客户忠诚度,并在市场上取得可持续的成功。
下面是我们如何根据会话数量创建留存段的方法:
# Define the retention segments based on number of sessions
def get_retention_segment(row):
    if row['Sessions'] >= 32: # 32 is mean of sessions
        return 'Frequent Users'
    else:
        return 'Occasional Users'

# Create a new column for retention segments
data['Retention Segment'] = data.apply(get_retention_segment, axis=1)

# Print the updated DataFrame
print(data)
输出
        Client ID  Sessions  Avg. Session Duration  Bounce Rate  \
0    5.778476e+08       367               1.583333        87.19
1    1.583822e+09       260               1.066667        29.62
2    1.030699e+09       237               0.033333        99.16
3    1.025030e+09       226               2.366667        25.66
4    1.469968e+09       216               1.383333        46.76
..            ...       ...                    ...          ...
994  1.049263e+09        17               7.733333        41.18
995  1.145806e+09        17               5.616667        47.06
996  1.153811e+09        17               0.200000        94.12
997  1.182133e+09        17               1.216667        88.24
998  1.184187e+09        17               2.566667        64.71

    Bounce Rate Segment  Total Session Duration Retention Segment
0                  High              581.083333    Frequent Users
1                   Low              277.333333    Frequent Users
2                  High                7.900000    Frequent Users
3                   Low              534.866667    Frequent Users
4                Medium              298.800000    Frequent Users
..                  ...                     ...               ...
994              Medium              131.466667  Occasional Users
995              Medium               95.483333  Occasional Users
996                High                3.400000  Occasional Users
997                High               20.683333  Occasional Users
998              Medium               43.633333  Occasional Users

[999 rows x 7 columns]
上面的函数接受一行数据作为输入。它根据每行的会话数分配留存段。如果会话数大于或等于32(会话的平均值),则函数返回“频繁用户”。否则,它返回“临时用户”。
现在让我们来看看留存段的平均跳出率:
# Calculate the average bounce rate for each retention segment
segment_bounce_rates = data.groupby('Retention Segment')['Bounce Rate'].mean().reset_index()

# Create a bar chart to visualize the average bounce rates by retention segment
bar_fig = px.bar(segment_bounce_rates, x='Retention Segment', y='Bounce Rate',
                 title='Average Bounce Rate by Retention Segment',
                 labels={'Retention Segment': 'Retention Segment', 'Bounce Rate': 'Average Bounce Rate'})

bar_fig.show()
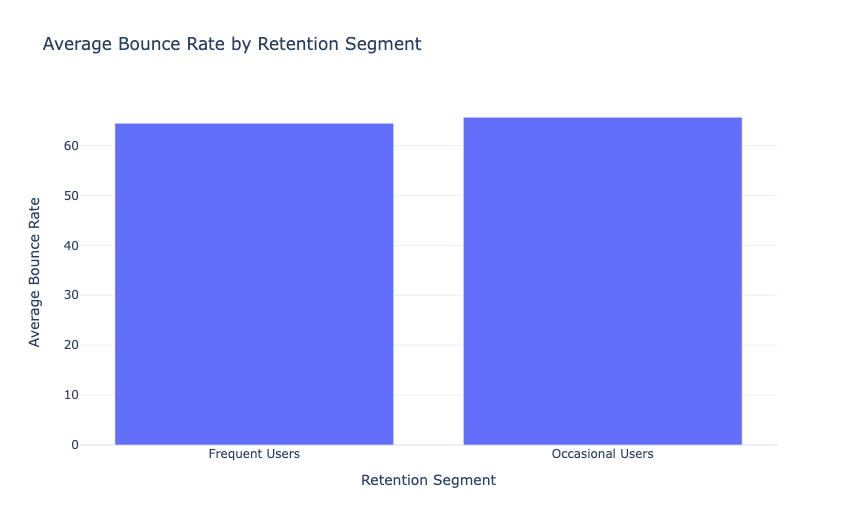
因此,频繁用户和偶尔用户的平均跳出率之间没有太大差异。现在让我们来看看保留用户的百分比:
# Count the number of users in each retention segment
segment_counts = data['Retention Segment'].value_counts()

# Define the pastel colors
colors = ['#FFB6C1', '#87CEFA']

# Create a pie chart using Plotly
fig = px.pie(segment_counts,
             values=segment_counts.values,
             names=segment_counts.index,
             color=segment_counts.index,
             color_discrete_sequence=colors,
             title='User Retention Rate')

# Update layout and show the chart
fig.update_traces(textposition='inside', textinfo='percent+label')
fig.update_layout(showlegend=False)
fig.show()
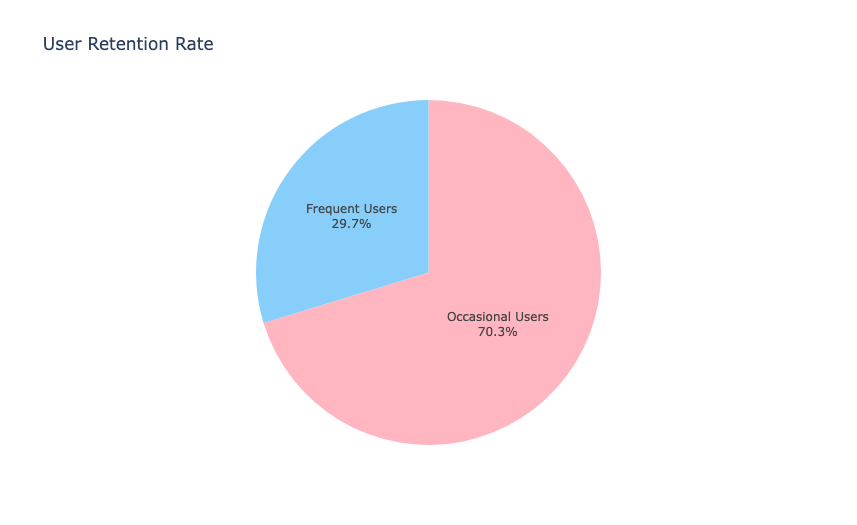
在1000个用户的数据中,平台留存了29.7%的经常访问平台的用户(297个用户)。这个留存率一点也不差。
本文来自互联网用户投稿,该文观点仅代表作者本人,不代表本站立场。本站仅提供信息存储空间服务,不拥有所有权,不承担相关法律责任。 如若内容造成侵权/违法违规/事实不符,请联系我的编程经验分享网邮箱:veading@qq.com进行投诉反馈,一经查实,立即删除!