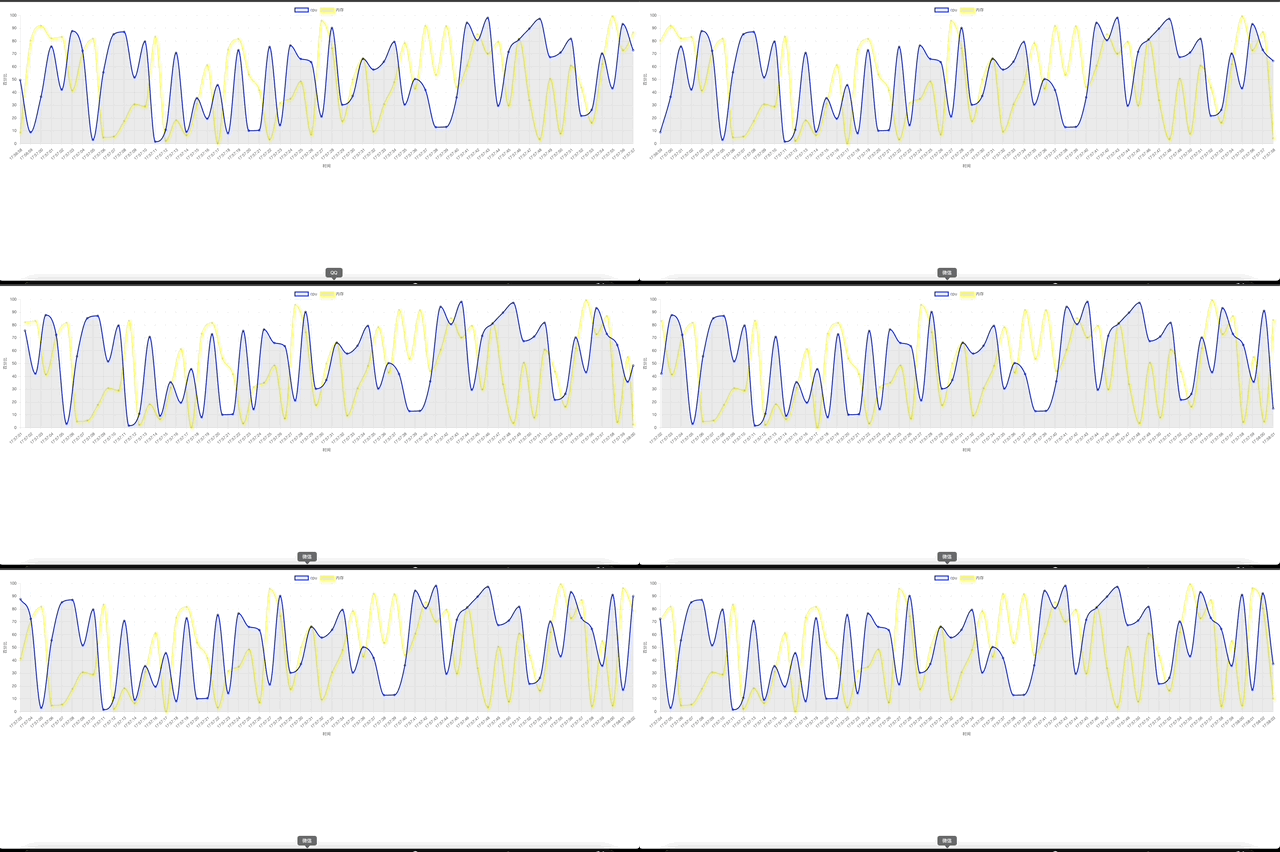
Chart.js 实现实时动态折线图 并限制最大长度
2023-12-15 18:49:58

<!DOCTYPE html>
<html>

<head>
    <title>模拟</title>
    <script src="https://lib.sinaapp.com/js/jquery/3.1.0/jquery-3.1.0.min.js"></script>
    <script src="https://cdn.staticfile.org/Chart.js/3.9.1/chart.js"></script>
</head>
<body>
    <canvas id="lineChart" style="height: 30vh;width: 50vw;"></canvas>
</body>
<script>
    $(document).ready(function () {
        var ctx = $("#lineChart")[0].getContext("2d");
        var lineChart = new Chart(ctx, {
            type: 'line',
            tension: 0.5,
            data: {
                labels: [], // x轴标签
                datasets: [{
                    label: 'cpu', // 数据集1标签
                    data: [], // 数据集1
                    borderColor: 'blue', // 折线1颜色
                    fill: true,// 不填充区域
                    cubicInterpolationMode: 'monotone' //曲线
                },
                {
                    label: '内存', // 数据集2标签
                    data: [], // 数据集2
                    borderColor: 'yellow', // 折线2颜色
                    fill: false, // 不填充区域
                    cubicInterpolationMode: 'monotone' //曲线
                }]
            },
            options: {
                responsive: true,
                scales: {
                    x: {
                        display: true,
                        title: {
                            display: true,
                            text: '时间' // x轴标题
                        }
                    },
                    y: {
                        display: true,
                        title: {
                            display: true,
                            text: '百分比' // y轴标题
                        }
                    }
                }
            }
        });

        // 模拟实时数据更新
        setInterval(function () {
            // 检查数据集的长度 限制最多六十秒的数据
            if (lineChart.data.labels.length >= 60) {
                lineChart.data.labels.shift(); // 删除最开始的x轴标签
                lineChart.data.datasets[0].data.shift(); // 删除最开始的数据点从数据集1
                lineChart.data.datasets[1].data.shift(); // 删除最开始的数据点从数据集2
            }

            var time = new Date().toLocaleTimeString();
            var value1 = Math.random() * 100; // 生成随机数值1
            var value2 = Math.random() * 100; // 生成随机数值2
            lineChart.data.labels.push(time); // 添加新的x轴标签
            lineChart.data.datasets[0].data.push(value1); // 添加新的数据点到数据集1
            lineChart.data.datasets[1].data.push(value2); // 添加新的数据点到数据集2
            lineChart.update(); // 更新图表
        }, 1000); // 每秒更新一次
    });


</script>

</html>
文章来源:https://blog.csdn.net/weixin_40195422/article/details/135022886
本文来自互联网用户投稿,该文观点仅代表作者本人,不代表本站立场。本站仅提供信息存储空间服务,不拥有所有权,不承担相关法律责任。 如若内容造成侵权/违法违规/事实不符,请联系我的编程经验分享网邮箱:veading@qq.com进行投诉反馈,一经查实,立即删除!
本文来自互联网用户投稿,该文观点仅代表作者本人,不代表本站立场。本站仅提供信息存储空间服务,不拥有所有权,不承担相关法律责任。 如若内容造成侵权/违法违规/事实不符,请联系我的编程经验分享网邮箱:veading@qq.com进行投诉反馈,一经查实,立即删除!