使用异构图学习破解推荐系统 - 第 1 部分
????????所以,这是独家新闻:异质图拥有一个充满潜力的世界,而常规图却无法做到这一点。传统的同构图很难处理不同关系和边类型的复杂性。现在是大炮的时候了——先进的架构可以解决具有多种边缘和关系类型的数据集的复杂性。在本文中,我们将学习如何从表格数据集创建异质图。
现在,让我们来分解一下:

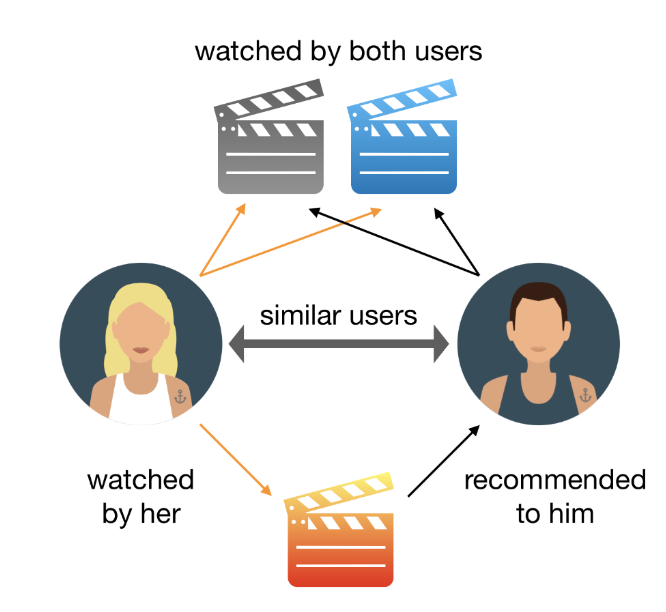
作为链接预测任务的推荐
二、数据集摄取
? ? ? ?我们将首先从MovieLens获取并加载平面 CSV?,以便我们能够向用户推荐电影。因为我们还没有深入研究本体,所以我们将手动将 CSV 文件建模为属性标记图,提取尽可能多的信息 😬
# Define utility functions
def log_dataframe_details(df: pd.DataFrame, filename: str) -> None:
    print(f"\n{filename} - {len(df)} records")
    print('-' * 50)
    print(f'Index: {df.index.name}\t Unique values in columns')
    for column in df.columns:
        print(f'{column}: {len(df[column].unique())}')
    print('=' * 100)


def load_csv(filename: str, index_col: str = 'movieId', verbose: bool = False) \
        -> pd.DataFrame:
    """
     Load a CSV file into a Pandas DataFrame, and perform optional preprocessing.


    :param filename: he name of the CSV file to load (without the .csv extension).
    :param index_col: The column to be used as the DataFrame index. Default is 'movieId'.
    :param verbose: If True, print DataFrame details after loading. Default is False.
    :return: The loaded and optionally preprocessed DataFrame.
    """
    # Construct the file path using the current working directory
    filepath = os.path.join(os.getcwd(), './ml-latest', f'{filename}.csv')
    # Read the CSV file into a DataFrame and set the index column
    df = pd.read_csv(filepath, index_col=index_col).sort_index()
    # Remove the 'timestamp' column if present
    if 'timestamp' in df.columns:
        df.drop(columns=['timestamp'], inplace=True)
    if verbose: # Optionally, print DataFrame details if verbose mode is enabled
        log_dataframe_details(df, filename)
    return df


# Load flat files into memory
movies = load_csv(filename='movies')
ratings = load_csv(filename='ratings')
tags = load_csv(filename='tags')
genome_scores = load_csv(filename='genome-scores', verbose=True)

# Not relevant
# links = load_csv(filename='links')
# genome_tags = load_csv(filename='genome-tags', index_col='tagId')
MovieId 的标签相关性数据集
该
genome_scores数据集揭示了不同标签与电影的相关性。现在,这些标签不再是随意乱扔的;而是随处可见。每个标签都分配有一个数字相关值(范围为 0 到 5)。在此数据集中,我们有两个主要列:
-?tagId:每个标签的唯一标识符
-?relevance:是我们之前提到的数值,表示标签与特定电影的关联程度。值越高,连接越强。
print(genome_scores.head())
print(f'Unique tag ids: {len(genome_scores.tagId.unique())}')
print(f'Unique movies tagged: {len(genome_scores.index.unique())}')
????????现在,让我们深入研究一些统计数据。我们总共有1128独特的标签 ID 和16376独特的电影。这就是事情变得聪明的地方。在数据集中的 86K 部电影中,只有 16376 部具有标签相关性得分。让我们通过关注这些电影来保持数据集的紧凑和整洁。为什么?因为当我们使用这些 1128 长度的数值向量对电影进行编码时,我们不希望混合中出现任何缺失值。

标签数据集
“movieId”告诉我们哪部电影收到了标签,而“userId”则揭示了大胆的标签者。最后,“标签”是涂鸦本身——捕捉用户对电影想法的单词或短语。总共有 25280 个唯一的用户 ID,每个 ID 都有自己的标记风格。现在,情况出现了变化:在 33 万潜在用户中,只有 25280 人加入了标记队伍。让我们根据用户的标签选择对他们进行编码 - 如果两个用户倾向于使用相似的标签,我们就会假设他们有相似的品味。这并不能保证是事实,但是嘿,我们正在使用我们获得的数据。因此,我们正在创建数据集的子集,重点关注具有共同标签的用户和电影。
# Filter dataset based on movieId present in genome-scores
moviesId = np.unique(genome_scores.index)
# Consider only movies which have a relevance scores in genome_scores
tags= tags[tags.index.isin(moviesId)]
usersId = np.unique(tags.userId)

print(f'Filtering datasets for: {len(moviesId)} movies & {len(usersId)} users')
movies = movies[movies.index.isin(moviesId)]
ratings = ratings[(ratings.index.isin(moviesId)) & (ratings.userId.isin(usersId))]

log_dataframe_details(movies, filename='movies')
log_dataframe_details(ratings, filename='ratings')
log_dataframe_details(tags, filename='tags')
三、异质图揭幕
????????我们将探讨异形图像的概念,展示其独特的优势。在这里,我们还将使用电影镜头数据集的上下文来构建它,并具有附加边缘属性以增强其功能。
????????异形图提供了一种独特的方式,以灵活的数据格式表示复杂的现实世界场景。在这种类型的图中,节点和边可以属于不同的类别,从而可以对不同的关系进行更准确的建模。例如,考虑一个以用户、产品和各种交互作为节点和边的推荐系统。这种复杂性超出了具有单个节点和边类型的单个同构图可以处理的范围。
????????PyTorch Geometric 提供了处理异构图的有效工具。然而,虽然该库功能强大,但仍需要更全面的示例和讨论,以有效地将表格数据集建模为用于 GNN 训练的异构图。本文旨在通过利用 Movielens 数据集并精心打造电影推荐系统来弥补这一差距。
????????异构图的优势是深远的,展示了它们对基于图的高级分析(例如个性化推荐、链接预测和社区检测)的影响。以下是这些图表如何显着增强现有推荐系统的方法:
- 捕获复杂的关系:推荐系统在理解用户和项目之间的各种交互方面蓬勃发展。异构图擅长精确捕获这些复杂的关系,从而对用户偏好进行卓越的建模。
- 上下文推荐:异构图通过结合时间、位置和设备类型等因素来实现上下文感知推荐。这会产生高度个性化的建议。
- 解决冷启动问题:在处理新用户或交互历史记录有限的项目时,异构图会集成附加信息,例如用户人口统计或项目属性。这会带来更明智、更准确的建议。
- 缓解数据稀疏性:传统方法经常与数据稀疏性作斗争。与基于邻接矩阵的方法不同,异构图直接将源节点和目标节点之间的关系建模为三元组,从而减轻了数据稀疏性问题。
- 促进跨域推荐:在音乐和电影等不同领域,异构图无缝地支持跨域推荐。这利用共享的用户行为和属性来提供更全面的建议。
让我们对句子转换器架构提供的文本细节进行更多预处理
class TextEncoder:
    """
    A class for encoding text using a SentenceTransformer model.
    """
    def __init__(self, model='all-MiniLM-L6-v2', device=None):
        """
        :param model: Name of the SentenceTransformer model to use.
        :param device: Device to use for model inference. Default is None.
        """
        self.device = device
        self.model = SentenceTransformer(model, device=self.device)

    @torch.no_grad()
    def __call__(self, values: list):
        """
        Encode a list of text values into embeddings.

        :param values: List of text values to encode.
        :return: Encoded embeddings as a PyTorch tensor.
        """
        x = self.model.encode(values,
                              show_progress_bar=True,
                              convert_to_tensor=True,
                              device=self.device)
        return x.cpu()


# Check if CUDA is available, and set the device accordingly
device = 'cuda:0' if torch.cuda.is_available() else 'cpu'
# Create an instance of the TextEncoder class with the determined device
encoder = TextEncoder(device=device)
四、表格到图表的转换
????????接下来将深入解释如何将表格数据转换为异形图格式。我们筛选了数据世界并选择了我们的明星——16376 部电影和 24683 位用户。
# Create a data object of type `torch_geometric.data.HeteroData`
graph = HeteroData()
# Identify node types ['movie', 'users'] using a single string
graph['movie'].node_id = torch.tensor(moviesId, dtype=torch.uint8)
graph['users'].node_id = torch.tensor(usersId, dtype=torch.uint8)
print(graph)
# Initialize feature vectors for movie nodes and user nodes
print(f"> Encoding Movie Titles...")
title_encoded = encoder(movies.title.values)
print(f"> Encoding Genres ...")
genres_encoded = encoder(movies.genres.values)

# Group genome scores by movieId and create a dictionary with relevance lists
genome_scores_dict = genome_scores.groupby(
    genome_scores.index.name)['relevance'].apply(list).to_dict()
genome_scores_dict = dict(sorted(genome_scores_dict.items()))
genome_scores_encoded = torch.tensor(list(genome_scores_dict.values()))


print('Movie nodes feature matrices:')
print(f'Title: {title_encoded.shape}')
print(f'Genre: {genres_encoded.shape}')
print(f'Genome: {genome_scores_encoded.shape}')
graph['movie'].title = title_encoded
graph['movie'].genres = genres_encoded
graph['movie'].genome_scores = genome_scores_encoded
print(graph)
电影实体类型的节点特征
# Group user tags by userId and concatenate them
users_tags = tags.groupby(
    tags.userId)['tag'].apply(lambda x: ', '.join(x))
print(f"> Encoding User Tags...")
users_tags_encoded = encoder(users_tags.values)

print('User nodes feature matrices:')
print(f'Tags Used: {users_tags_encoded.shape}')
graph['users'].tags = users_tags_encoded
print(graph)
用户实体类型的节点功能
# Create edges and edge properties for user-rating-movie relationships
src_node_ids = torch.tensor(ratings.userId.values, dtype=torch.long)
dst_node_ids = torch.tensor(ratings.index.values, dtype=torch.long)
user_rating_movie_edge_index = torch.stack([src_node_ids, dst_node_ids], dim=0)
user_rating_movie_edge_attr = torch.tensor(ratings.rating.values, dtype=torch.float32)

# Set edge information for user-rating-movie relationships
graph['users', 'ratings', 'movie'].edge_index = user_rating_movie_edge_index
graph['users', 'ratings', 'movie'].edge_attr = user_rating_movie_edge_attr
print(graph)
????????但是没有连接的网络是什么?这就是我们的优势发挥作用的地方。它们就像将节点连接在一起的桥梁,揭示了我们数据星系内的关系。
????????特别是,让我们关注这种(users, ratings, movie)关系——这是一个三元组的联系,在用户、他们的评分和他们评分的电影之间架起了一座桥梁。告诉edge_index我们谁与谁有联系,而 则edge_attr给我们本身的评级。
# Create edges and edge properties for user-tag-movie relationships
user_tag_movie_edge_attr = tags.groupby(
    [tags.userId, tags.index])['tag'].apply(lambda x: ', '.join(x))

src_node_ids = torch.tensor(user_tag_movie_edge_attr.index.get_level_values(
    'userId').values, dtype=torch.long)
dst_node_ids = torch.tensor(user_tag_movie_edge_attr.index.get_level_values(
    'movieId').values, dtype=torch.long)
user_tags_movie_edge_index = torch.stack([src_node_ids, dst_node_ids], dim=0)
print(f"> Encoding edges between users, tags, and movies...")
user_tag_movie_edge_attr = encoder(user_tag_movie_edge_attr.values)

# Set edge information for user-tag-movie relationships
graph['users', 'tags', 'movie'].edge_index = user_tags_movie_edge_index
graph['users', 'tags', 'movie'].edge_attr = user_tag_movie_edge_attr
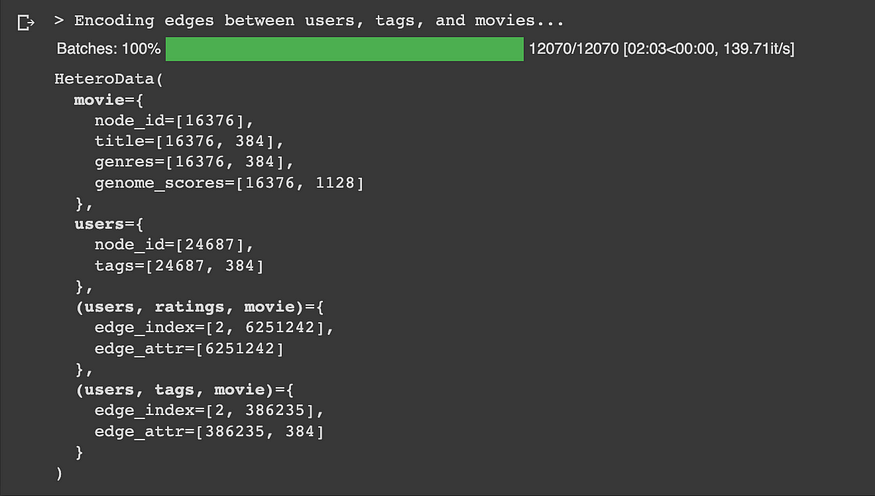
print(graph)
边缘特征表示
五、图保存
????????这就是我们穿越异形图和 PyTorch 几何的迷人世界的旅程。
????????总而言之,PyTorch Geometric 中的异构图提供了一个强大的框架,用于建模各个领域中的复杂关系。在推荐系统的背景下,它们超越了传统数据建模结构的限制。通过准确地表示不同的交互、解决冷启动问题、提供上下文感知推荐、管理数据稀疏性以及实现跨域推荐,异构图成为在广泛的业务领域构建精确有效的推荐系统的重要工具。推荐系统只是冰山一角。想一想——社交图谱、电子商务奇迹和用户评级的宝库。我们学习了如何创建异构图、如何为平面文件注入活力以及如何为革命性技巧奠定基础。
# Now the 'graph' object contains the processed data and relationships between nodes and edges.
# It can be used for various graph-related tasks.
# Save the dataset
filepath = os.path.join(os.getcwd(), 'movielens_hetero.pt')
torch.save(graph, filepath)????????在我们告别之前,让我们来谈谈一个小小的挑战——可扩展性。当然,我们有一个50k节点网络和惊人的10 million边缘。这就像拥有一座繁华的数据大都市。但不用担心,我们的下一部分将深入研究 LinkNeighborLoaders、RandomSamplers 等的魔力。我们将创建让任何厨师都嫉妒的批次 - 适合我们 GPU 内存的批次,并为 GNN 训练和下游链接预测任务执行数据分割。敬请关注!
本文来自互联网用户投稿,该文观点仅代表作者本人,不代表本站立场。本站仅提供信息存储空间服务,不拥有所有权,不承担相关法律责任。 如若内容造成侵权/违法违规/事实不符,请联系我的编程经验分享网邮箱:veading@qq.com进行投诉反馈,一经查实,立即删除!
