AI项目十八:YOLOV8自训练关键点检测一
若该文为原创文章,转载请注明原文出处。
记录学习YOLOV8过程,自训练关键点检测模型。
清华源:-i https://mirror.baidu.com/pypi/simple
1、yolov8安装
git clone https://github.com/ultralytics/ultralytics
?
cd ultralytics
?
pip install -e .
安装成功后,使用命令 yolo 简单看下版本
(yolov8) llh@anhao:/$ yolo version
?
8.0.206
2、简单测试
下载权重文件
GitHub - ultralytics/ultralytics: NEW - YOLOv8 🚀 in PyTorch > ONNX > OpenVINO > CoreML > TFLite
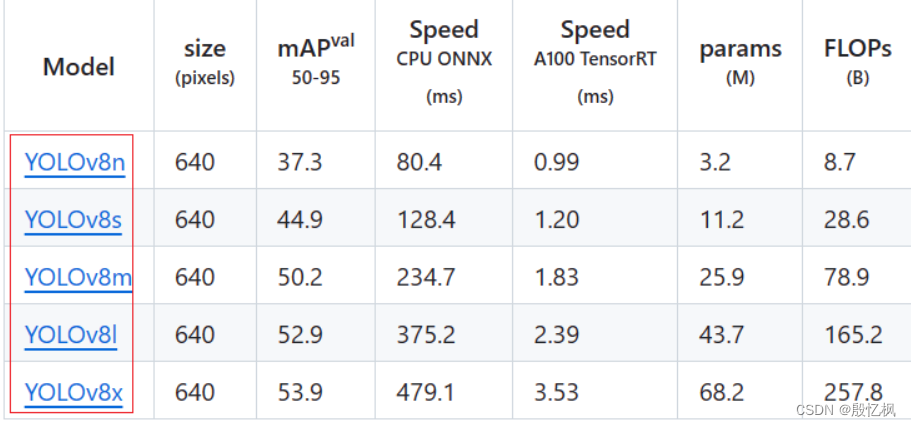
直接点击下载。
获取测试图片的文件在ultralytics\assets目录有,使用的是的里面的bus.jpg测试。
使用 yolo 命令进行测试
yolo detect predict model=./yolov8n.pt source=./bus.jpg
 输出在runs/detect/predict/目录下。
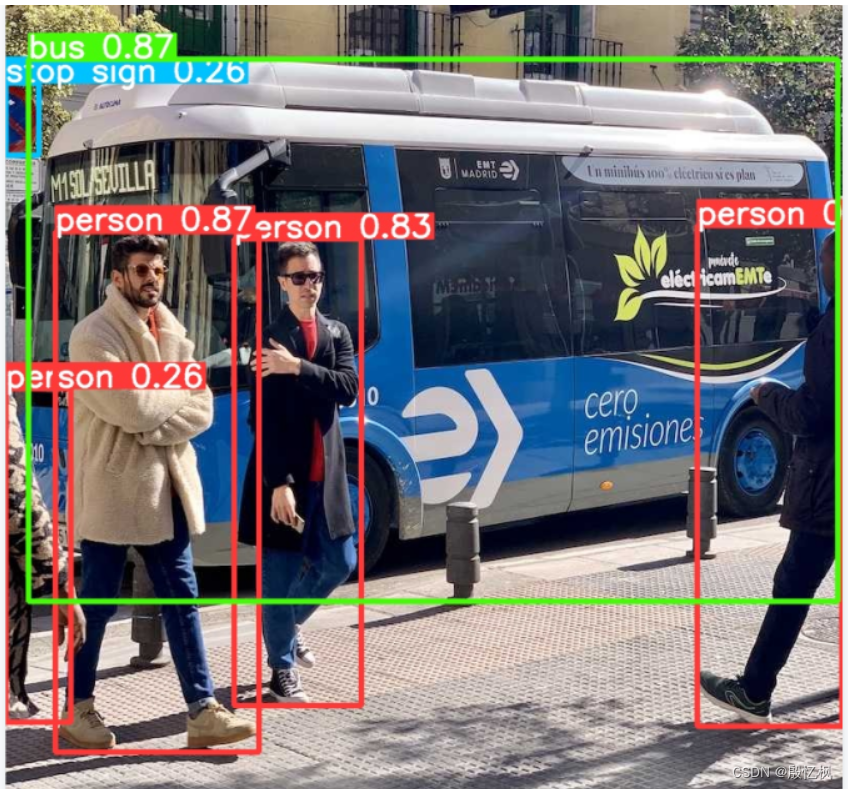
3、安装labelme
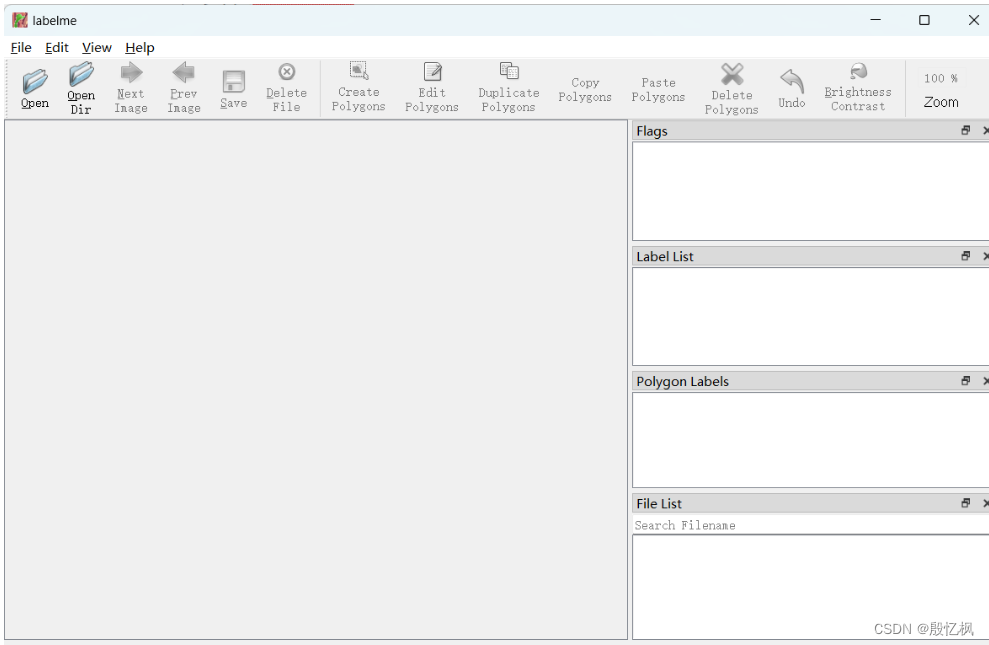
pip install labelme直接在终端运行labelme打开软件
 先取消“保存图片数据”(减少标注文件大小);在文件下
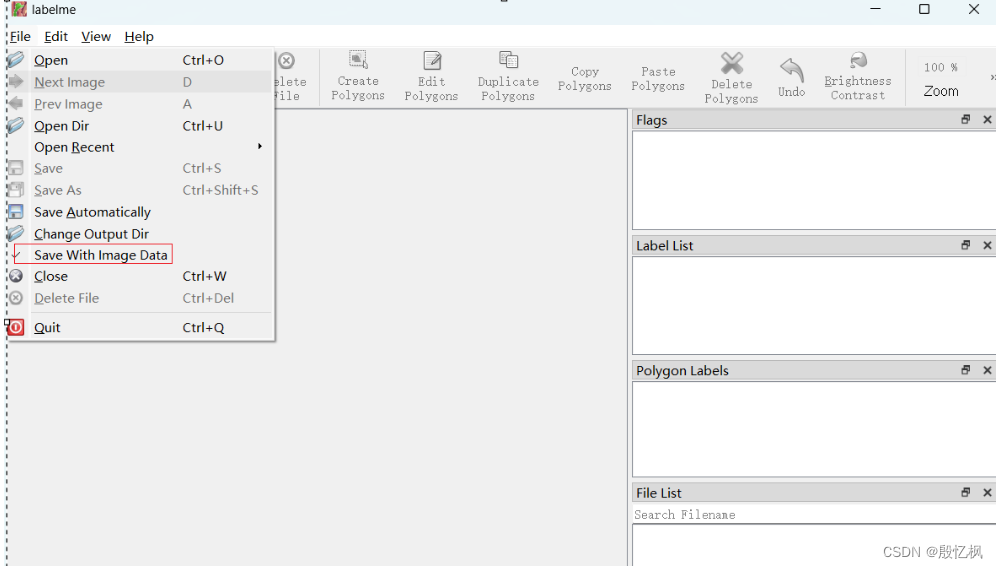 打开文件目录
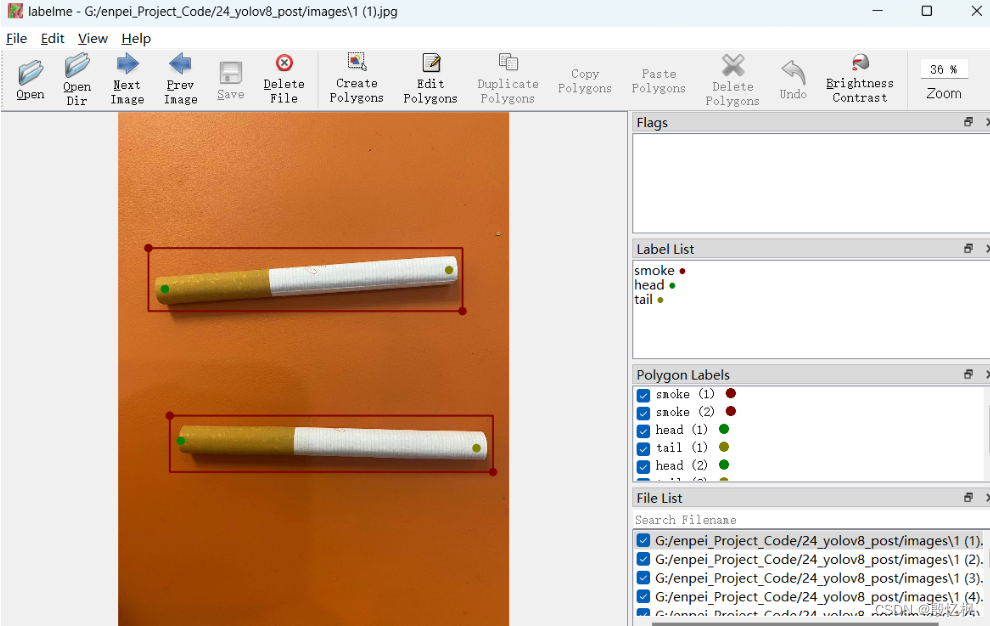 接下来标注
接下来标注
-
先标注检测框,检测框用Create Rectangle(Ctrl+N)
-
填写类别名称
-
填写
group_id,用于匹配后续标注的关键点,以当前画面中出现的顺序标注即可。
-
-
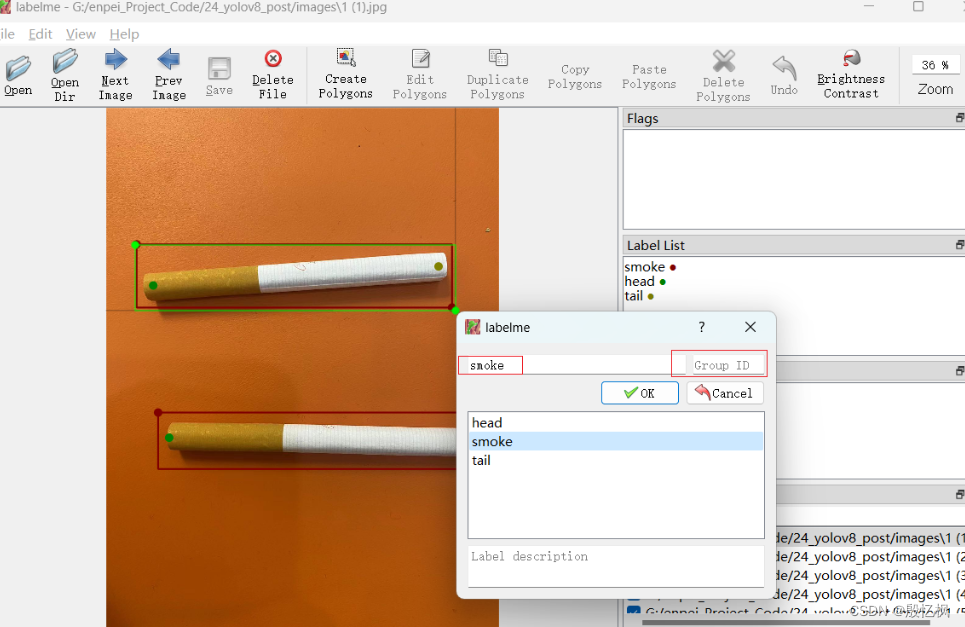 标注关键点,检测关键点用Create Point
-
按关键点顺序标注,如我们的顺序是
head、tail,不可以错; -
填写关键点名称,如这里是
head; -
填写关键点所在物体的
group_id,匹配检测框
-
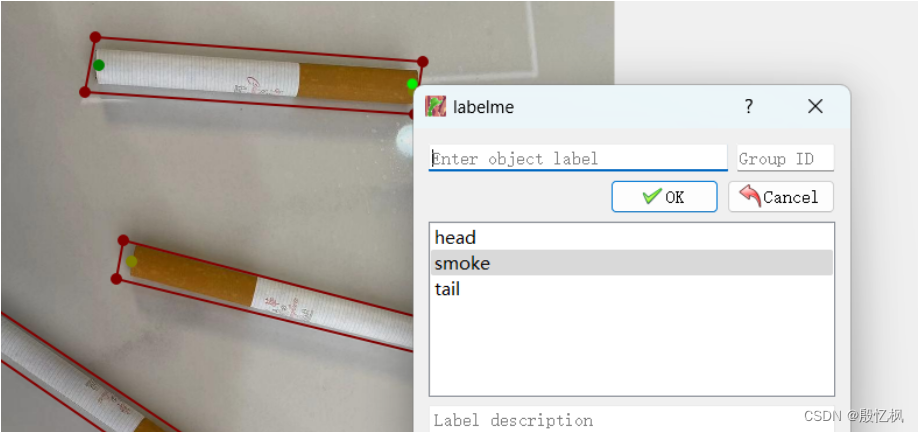 注意,如果多个类型需要填写group_id,group_id要匹配检测框
4、把JSON转成TXT
使用labelme标注生成的JSON文件,不能直接训练,所以需要把JSON文件转成TXT文件。
打开一个标注json文件,内容大致如下:
version": "5.3.1",
  "flags": {},
  "shapes": [
 ?  {
 ? ?  "label": "smoke",
 ? ?  "points": [
 ? ? ?  [
 ? ? ? ?  389.0,
 ? ? ? ?  72.5
 ? ? ?  ],
 ? ? ?  [
 ? ? ? ?  957.0,
 ? ? ? ?  114.5
 ? ? ?  ],
 ? ? ?  [
 ? ? ? ?  949.0,
 ? ? ? ?  192.5
 ? ? ?  ],
 ? ? ?  [
 ? ? ? ?  379.0,
 ? ? ? ?  162.5
 ? ? ?  ]
 ? ?  ],
 ? ?  "group_id": null,
 ? ?  "description": "",
 ? ?  "shape_type": "polygon",
 ? ?  "flags": {}
 ?  },
但是yolov8 要求的标注文件长这样
0 0.662641 0.494385 0.674719 0.988771 0.717187 0.189583 2.000000 0.798438 0.127083 2.000000 0.701562 0.091667 2.000000 0.921875 0.118750 2.000000 0.000000 0.000000 0.000000 0.971875 0.379167 2.000000 0.554688 0.262500 2.000000 0.000000 0.000000 0.000000 0.367188 0.427083 2.000000 0.767188 0.772917 2.000000 0.421875 0.500000 2.000000 0.829688 0.960417 1.000000 0.517188 0.881250 1.000000 0.000000 0.000000 0.000000 0.000000 0.000000 0.000000 0.000000 0.000000 0.000000 0.000000 0.000000 0.000000根据这些规则,我们可以写一个转换脚本,将labelme标注的json格式转为yolo格式
labelme2yolo.py
# 将labelme标注的json文件转为yolo格式
import os
import cv2
import numpy as np
import matplotlib.pyplot as plt
import glob
import json
import tqdm
?
?
# 物体类别
class_list = ["smoke"]
# 关键点的顺序
keypoint_list = ["head", "tail"]
?
?
def json_to_yolo(img_data,json_data):
 ?  h,w = img_data.shape[:2]
 ?  # 步骤:
 ?  # 1. 找出所有的矩形,记录下矩形的坐标,以及对应group_id
 ?  # 2. 遍历所有的head和tail,记下点的坐标,以及对应group_id,加入到对应的矩形中
 ?  # 3. 转为yolo格式
?
 ?  rectangles = {}
 ?  # 遍历初始化
 ?  for shape in json_data["shapes"]:
 ? ? ?  label = shape["label"] # pen, head, tail
 ? ? ?  group_id = shape["group_id"] # 0, 1, 2, ...
 ? ? ?  points = shape["points"] # x,y coordinates
 ? ? ?  shape_type = shape["shape_type"]
?
 ? ? ?  # 只处理矩形
 ? ? ?  if shape_type == "rectangle":
 ? ? ? ? ?  if group_id not in rectangles:
 ? ? ? ? ? ? ?  rectangles[group_id] = {
 ? ? ? ? ? ? ? ? ?  "label": label,
 ? ? ? ? ? ? ? ? ?  "rect": points[0] + points[1],  # Rectangle [x1, y1, x2, y2]
 ? ? ? ? ? ? ? ? ?  "keypoints_list": []
 ? ? ? ? ? ? ?  }
 ?  # 遍历更新,将点加入对应group_id的矩形中
 ?  for keypoint in keypoint_list:
 ? ? ?  for shape in json_data["shapes"]:
 ? ? ? ? ?  label = shape["label"]
 ? ? ? ? ?  group_id = shape["group_id"]
 ? ? ? ? ?  points = shape["points"]
 ? ? ? ? ?  # 如果匹配到了对应的keypoint
 ? ? ? ? ?  if label == keypoint:
 ? ? ? ? ? ? ?  rectangles[group_id]["keypoints_list"].append(points[0])
 ? ?
 ?  # 转为yolo格式
 ?  yolo_list = []
 ?  for id, rectangle in rectangles.items():
 ? ? ?  result_list  = []
 ? ? ?  label_id = class_list.index(rectangle["label"])
 ? ? ?  # x1,y1,x2,y2
 ? ? ?  x1,y1,x2,y2 = rectangle["rect"]
 ? ? ?  # center_x, center_y, width, height
 ? ? ?  center_x = (x1+x2)/2
 ? ? ?  center_y = (y1+y2)/2
 ? ? ?  width = abs(x1-x2)
 ? ? ?  height = abs(y1-y2)
 ? ? ?  # normalize
 ? ? ?  center_x /= w
 ? ? ?  center_y /= h
 ? ? ?  width /= w
 ? ? ?  height /= h
?
 ? ? ?  # 保留6位小数
 ? ? ?  center_x = round(center_x, 6)
 ? ? ?  center_y = round(center_y, 6)
 ? ? ?  width = round(width, 6)
 ? ? ?  height = round(height, 6)
?
?
 ? ? ?  # 添加 label_id, center_x, center_y, width, height
 ? ? ?  result_list = [label_id, center_x, center_y, width, height]
?
 ? ? ?  # 添加 p1_x, p1_y, p1_v, p2_x, p2_y, p2_v
 ? ? ?  for point in rectangle["keypoints_list"]:
 ? ? ? ? ?  x,y = point
 ? ? ? ? ?  x,y = int(x), int(y)
 ? ? ? ? ?  # normalize
 ? ? ? ? ?  x /= w
 ? ? ? ? ?  y /= h
 ? ? ? ? ?  # 保留6位小数
 ? ? ? ? ?  x = round(x, 6)
 ? ? ? ? ?  y = round(y, 6)
 ? ? ? ? ? ?
 ? ? ? ? ?  result_list.extend([x,y,2])
?
 ? ? ?  yolo_list.append(result_list)
 ? ?
 ?  return yolo_list
?
?
# 获取所有的图片
img_list = glob.glob("./*.jpg")
?
for img_path in tqdm.tqdm( img_list ):
 ? ? ? ?
 ?  img = cv2.imread(img_path)
 ?  print(img_path)
 ?  json_file = img_path.replace('jpg', 'json')
 ?  with open(json_file) as json_file:
 ? ? ?  json_data = json.load(json_file)
?
 ?  yolo_list = json_to_yolo(img, json_data)
 ? ?
 ?  yolo_txt_path = img_path.replace('jpg', 'txt')
 ?  with open(yolo_txt_path, "w") as f:
 ? ? ?  for yolo in yolo_list:
 ? ? ? ? ?  for i in range(len(yolo)):
 ? ? ? ? ? ? ?  if i == 0:
 ? ? ? ? ? ? ? ? ?  f.write(str(yolo[i]))
 ? ? ? ? ? ? ?  else:
 ? ? ? ? ? ? ? ? ?  f.write(" " + str(yolo[i]))
 ? ? ? ? ?  f.write("\n")
?
运行后,把JSON生成TXT。
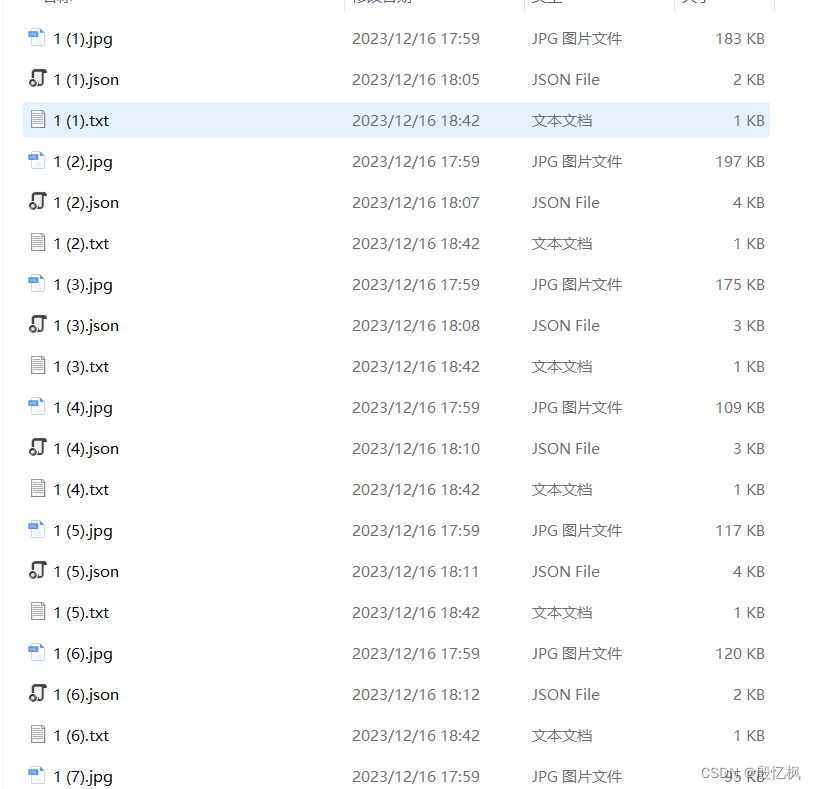
5、对yolo格式的标注进行可视化。检查标注是否正确。
先安装jupyter
pip install jupyter然后在终端输入
jupyter-labimport os
import cv2
import numpy as np
import matplotlib.pyplot as plt
import glob
img_path = './images/1.original_annotated/1 (20).jpg'
plt.figure(figsize=(15,10))
img = cv2.imread(img_path)
plt.imshow(img[:,:,::-1])
plt.axis('off')
yolo_txt_path = img_path.replace('jpg', 'txt')
print(yolo_txt_path)
with open(yolo_txt_path, 'r') as f:
lines = f.readlines()
lines = [x.strip() for x in lines]
label = np.array([x.split() for x in lines], dtype=np.float32)
# 物体类别
class_list = ["smoke"]
# 类别的颜色
class_color = [(255, 0, 0), (0, 255, 0), (0, 0, 255), (255,255,0)]
# 关键点的顺序
keypoint_list = ["head", "tail"]
# 关键点的颜色
keypoint_color = [(255, 0, 0), (0, 255, 0)]
# 绘制检测框
img_copy = img.copy()
h,w = img_copy.shape[:2]
for id,l in enumerate( label ):
# label_id ,center x,y and width, height
label_id, cx, cy, bw, bh = l[0:5]
label_text = class_list[int(label_id)]
# rescale to image size
cx *= w
cy *= h
bw *= w
bh *= h
# draw the bounding box
xmin = int(cx - bw/2)
ymin = int(cy - bh/2)
xmax = int(cx + bw/2)
ymax = int(cy + bh/2)
cv2.rectangle(img_copy, (xmin, ymin), (xmax, ymax), class_color[int(label_id)], 2)
cv2.putText(img_copy, label_text, (xmin, ymin-10), cv2.FONT_HERSHEY_SIMPLEX, 1, class_color[int(label_id)], 2)
# display the image
plt.figure(figsize=(15,10))
plt.imshow(img_copy[:,:,::-1])
plt.axis('off')
# save the image
cv2.imwrite("./tmp.jpg", img_copy)
img_copy = img.copy()
h,w = img_copy.shape[:2]
for id,l in enumerate( label ):
# label_id ,center x,y and width, height
label_id, cx, cy, bw, bh = l[0:5]
label_text = class_list[int(label_id)]
# rescale to image size
cx *= w
cy *= h
bw *= w
bh *= h
# draw the bounding box
xmin = int(cx - bw/2)
ymin = int(cy - bh/2)
xmax = int(cx + bw/2)
ymax = int(cy + bh/2)
cv2.rectangle(img_copy, (xmin, ymin), (xmax, ymax), class_color[int(label_id)], 2)
cv2.putText(img_copy, label_text, (xmin, ymin-10), cv2.FONT_HERSHEY_SIMPLEX, 2, class_color[int(label_id)], 2)
# draw 17 keypoints, px,py,pv,px,py,pv...
for i in range(5, len(l), 3):
px, py, pv = l[i:i+3]
# rescale to image size
px *= w
py *= h
# puttext the index
index = int((i-5)/3)
# draw the keypoints
cv2.circle(img_copy, (int(px), int(py)), 10, keypoint_color[int(index)], -1)
keypoint_text = "{}_{}".format(index, keypoint_list[index])
cv2.putText(img_copy, keypoint_text, (int(px), int(py)-10), cv2.FONT_HERSHEY_SIMPLEX, 1, keypoint_color[int(index)], 2)
plt.figure(figsize=(15,10))
plt.imshow(img_copy[:,:,::-1])
plt.axis('off')
# save
cv2.imwrite('./tmp.jpg', img_copy)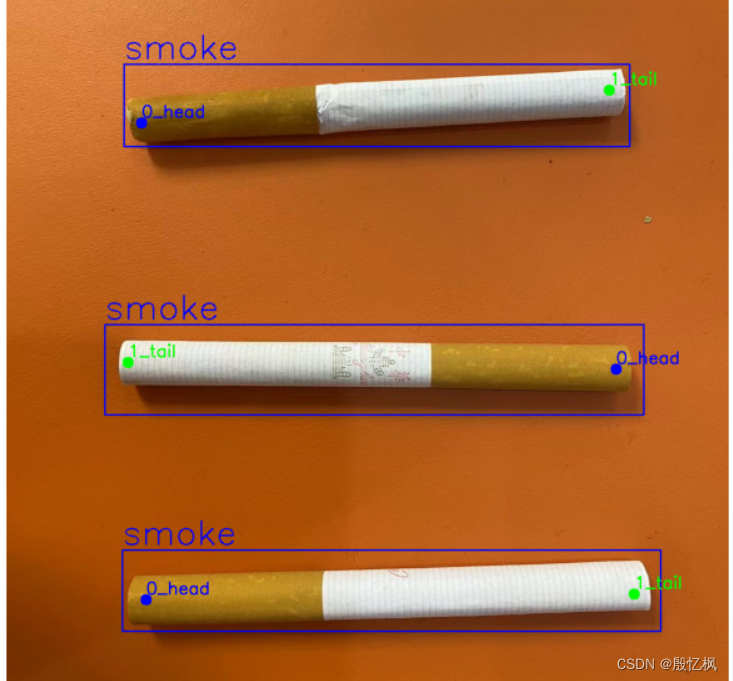
如有侵权,或需要完整代码,请及时联系博主。
本文来自互联网用户投稿,该文观点仅代表作者本人,不代表本站立场。本站仅提供信息存储空间服务,不拥有所有权,不承担相关法律责任。 如若内容造成侵权/违法违规/事实不符,请联系我的编程经验分享网邮箱:veading@qq.com进行投诉反馈,一经查实,立即删除!