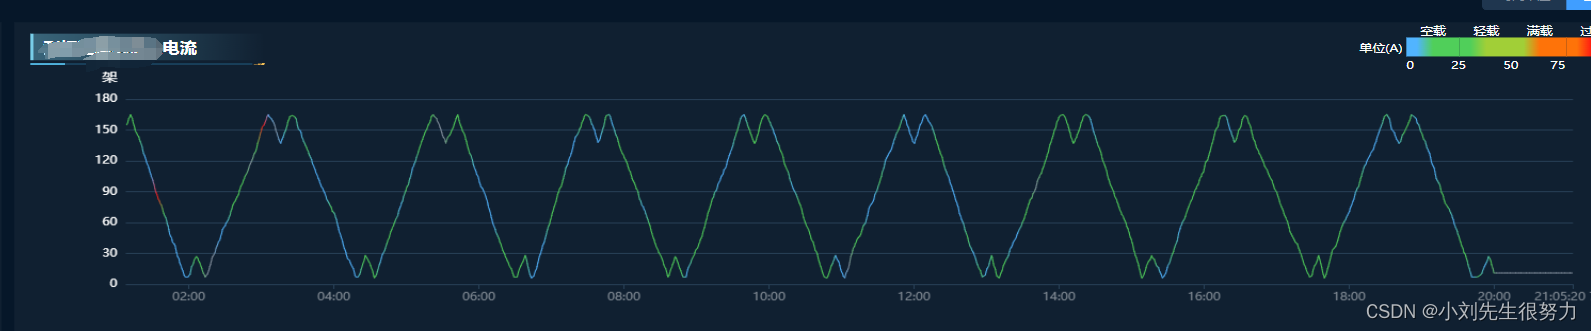
echarts 折线图根据x轴时间渲染不同颜色的折线
2023-12-29 15:27:52
footIm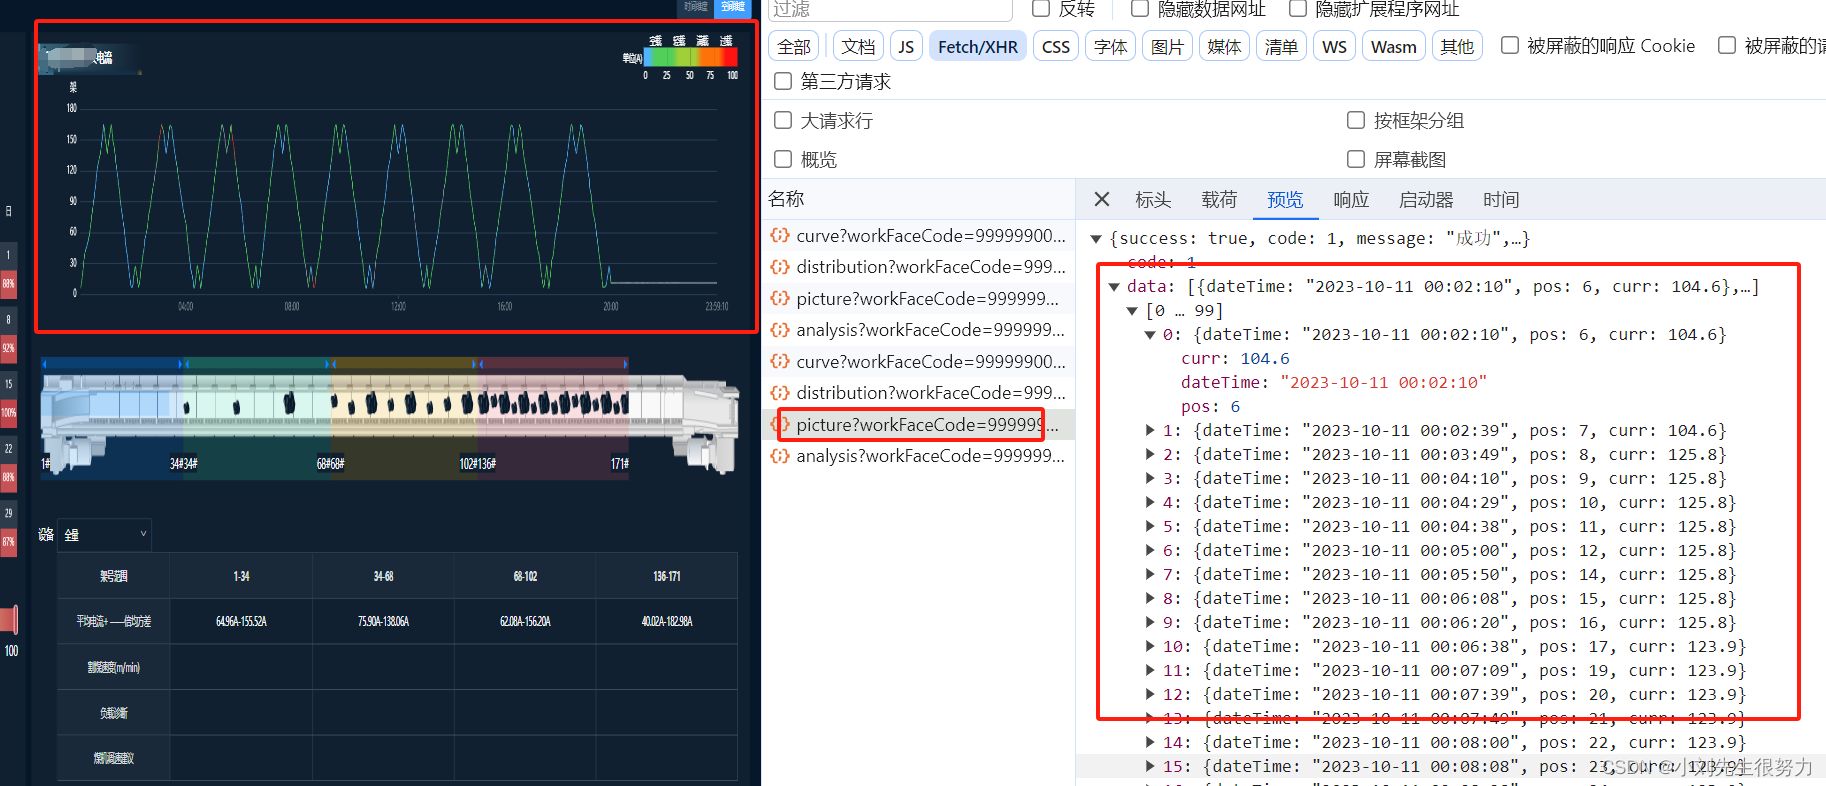
如上图所示一条折线多种颜色
后端数据返回"data": [
{
“dateTime”: “2023-10-11 00:02:10”,
“pos”: 6,
“curr”: 104.6
},
{
“dateTime”: “2023-10-11 00:02:39”,
“pos”: 7,
“curr”: 104.6
}, …]
我们拿到后端返回的res.data传递给我们的echarts 组件
进行渲染,数据处理。
export const pressureLineEcharts = (data, params) => {
if (data && data.length > 0) {
const color = [
'#84909E', '#51B4FF', '#50CF5A', '#FDCC10', '#FF1212'
]
let pieces = []
data.forEach((item, index) => {
const curr = Math.floor(item.curr / 50) > 4 ? 4 : Math.floor(item.curr / 50)
if (index < data.length - 1) {
pieces.push({
gte: window.$moment(item.dateTime).valueOf(),
lte: window.$moment(data[index + 1].dateTime).valueOf(),
color: item.curr ? color[curr] : '#84909E'
})
} else {
pieces.push({
gte: window.$moment(item.dateTime).valueOf(),
color: item.curr ? color[curr] : '#84909E'
})
}
})
return {
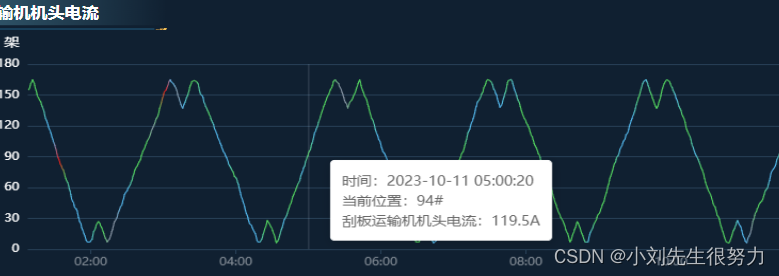
tooltip: {
trigger: 'axis',
formatter: params => {
const value = params[0].value
return `时间:${value[0]}
<br>当前位置:${value[1]}#
<br>${params[0].seriesName}:${value[2]}A`
}
},
grid: {
left: '6%',
right: '3%',
top: '36',
bottom: '36'
},
xAxis: [
{
type: 'time',
axisPointer: {
type: 'shadow'
},
axisLine: {
show: false,
lineStyle: {
color: '#294259',
width: 1,
type: 'solid'
}
},
axisLabel: {
color: '#838C95',
showMaxLabel: true
}
}
],
dataZoom: [
{
type: 'inside'
},
{
type: 'slider',
show: false
}
],
yAxis: [
{
name: '架',
nameLocation: 'end',
nameTextStyle: {
color: '#fff',
fontSize: 14,
padding: [0, 0, 0, -30]
},
type: 'value',
// 横坐标轴线
axisLine: {
show: false
},
// 纵坐标,刻度线
axisTick: {
show: false
},
// 是否显示横线
splitLine: {
show: true,
lineStyle: {
color: '#294259',
width: 1,
type: 'solid'
}
},
axisLabel: {
color: '#fff'
}
}
],
visualMap: [{
type: "piecewise",
show: false,
dimension: 0,
// seriesIndex: 0,
top: 0,
right: 20,
textStyle: {
color: '#fff'
},
orient: 'horizontal',
pieces
}],
series: [
{
name: '刮板运输机机头电流',
type: 'line',
symbol: 'none',
data: data.map(item => [item.dateTime, item.pos, item.curr]),
color: '#fff',
lineStyle: {
width: 1
}
}
]
}
} else {
return {
title: {
left: 'center',
top: 'center',
textStyle: {
fontSize: 14
},
subtext: '暂无数据'
}
}
}
}
文章来源:https://blog.csdn.net/lzfengquan/article/details/135289031
本文来自互联网用户投稿,该文观点仅代表作者本人,不代表本站立场。本站仅提供信息存储空间服务,不拥有所有权,不承担相关法律责任。 如若内容造成侵权/违法违规/事实不符,请联系我的编程经验分享网邮箱:veading@qq.com进行投诉反馈,一经查实,立即删除!
本文来自互联网用户投稿,该文观点仅代表作者本人,不代表本站立场。本站仅提供信息存储空间服务,不拥有所有权,不承担相关法律责任。 如若内容造成侵权/违法违规/事实不符,请联系我的编程经验分享网邮箱:veading@qq.com进行投诉反馈,一经查实,立即删除!