Pytorch项目,肺癌检测项目之四
# 安装图像处理 的两个包?simpleITK 和 ipyvolume?
# 安装缓存相关的两个包? diskcache 和 cassandra-driver
import gzip
from diskcache import FanoutCache, Disk
from cassandra.cqltypes import BytesType
from diskcache import FanoutCache,Disk,core
from diskcache.core import io
from io import BytesIO
from diskcache.core import MODE_BINARY
from util.logconf import logging
log+ logging.getLogger(_name_)
log.setLevel(logging.INFO)
import matplotlib
matplotlib.use('nbagg')
import numpy as np
import matplotlib.pyplot as plt
from codel.dsets import Ct ,LunaDataset
clim = (-1000.0,300)
def findPositiveSamples(start_ndx=0,limit=100):
? ? ds = LinaDataset()
? ? positiveSample_list = []
? ? for sample_tup in ds.candidateInfo_list:
? ? ? ? if sample_tup.isNodule_bool:
? ? ? ? ? ? #print(len(positiveSanple_list),sample_tup)
? ? ? ? if len(positiveSample_list)>=linit:
? ? ? ? ? ? break
? ? return positiveSample_list
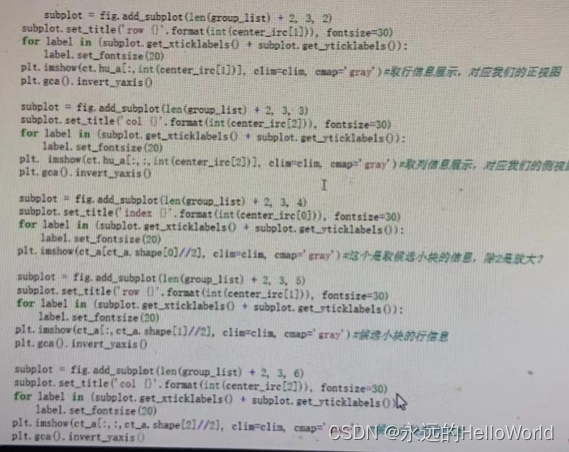
def showCandidate(series_uid,batch_ndx=None, **kwargs):
? ? ds = LunaDataset(series_uid=series_uid,**kwargs)
? ? pos_list = [i for i, x in enumerate(ds.candidateInfo_list) if x.isNodule_bool]
? ??
? ? if batch_ndx is None:
? ? ? ? if pos_list:
? ? ? ? ? ? batch_ndx = pos_list[0]
? ? ? ? else:
? ? ? ? ? ? print("Warning: no positive samples found : using frist negative sample.")
? ? ? ? ? ??
? ? ? ? ? ? batch_ndx = 0
? ? cd = Ct(series_uid)
? ? cd_t,pos_t,series_uid,center_irc = ds[batch_ndx]
? ? ct_a = ct_t[0].numpy()
? ? #图像的设置问题,设置图片的大小
? ? fig = plt.figure(figsize=(30,50))
? ? #设置切片位置
? ? group_list = [[9,11,13],[15,16,17],[19,21,23]]
? ??
? ? # add_subplot(3,4,,9) 写在三行四列第九个位置
? ? subplot = fig.add_subplot(len(grooup_list)+2,3,1)
? ??
? ? sub.set_title('index {}'.format(int(center_irc[0])),fontsize=30)
? ??
? ? for label in (subplot.get_xticklabels()+ subplot.get_yticklabels()):
? ? ? ? label.set_fontsize(20)
? ? plt.imshow(ct.hu_a[int(center_irc[0])],clim=clim,cmap='gray')

for row index_list in enumerate(group_list):
? ? for col,index in enumerate(index_list):
? ? ? ? subplot=fig.add_subplot(len(group_list)+2,3,row*3+clo+7)
? ? ? ? subplot.set_title('sicle {}'.format(index),fontsize=30)
? ? ? ? for label in (subplot.get_xticklabels() + subplot.get_vticklabels()):
? ? ? ? ? ? label.set_fontsize(20)
? ? ? ? ? ? plt.imshow(ct_a[index],clim=clim,cmap='gary')
print(series_uid,batch_ndx,bool(pos_t[0]),pos_list)
总结:
(1)肺部肿瘤检测项目介绍
(2)了解CT数据,定制方案
(3)下载项目中使用的数据集
(4)对数据集进行处理
(5)如何可视化CT数据
问题挑战和思考调研
(1)缓存部分去掉加载数据集需要多长时间
(2)网站grand-challenge网站上还有木有以CT数据作为数据源的项目
(3)了解下除了CT图像数据,还有什么3D图像
本文来自互联网用户投稿,该文观点仅代表作者本人,不代表本站立场。本站仅提供信息存储空间服务,不拥有所有权,不承担相关法律责任。 如若内容造成侵权/违法违规/事实不符,请联系我的编程经验分享网邮箱:veading@qq.com进行投诉反馈,一经查实,立即删除!