工具系列:TimeGPT_(6)同时预测多个时间序列
2023-12-28 11:02:04
TimeGPT提供了一个强大的多系列预测解决方案,它涉及同时分析多个数据系列,而不是单个系列。该工具可以使用广泛的系列进行微调,使您能够根据自己的特定需求或任务来定制模型。
# Import the colab_badge module from the nixtlats.utils package
from nixtlats.utils import colab_badge
# 导入colab_badge模块,用于在Colab中显示徽章
colab_badge('docs/tutorials/6_multiple_series')
# 导入load_dotenv函数,用于加载.env文件中的环境变量
from dotenv import load_dotenv
# 加载环境变量配置文件
load_dotenv()
True
# 导入pandas和TimeGPT模块
import pandas as pd
from nixtlats import TimeGPT
/home/ubuntu/miniconda/envs/nixtlats/lib/python3.11/site-packages/statsforecast/core.py:25: TqdmWarning: IProgress not found. Please update jupyter and ipywidgets. See https://ipywidgets.readthedocs.io/en/stable/user_install.html
  from tqdm.autonotebook import tqdm
# 定义TimeGPT对象,传入token参数,该参数默认值为os.environ.get("TIMEGPT_TOKEN")
# 这里使用了自己提供的token,用于身份验证和访问TimeGPT API

timegpt = TimeGPT(
    token = 'my_token_provided_by_nixtla'
)
# 创建一个TimeGPT对象,用于生成时间相关的文本。
timegpt = TimeGPT()
以下数据集包含不同电力市场的价格。让我们看看如何进行预测。预测方法的主要参数是包含要预测的时间序列的历史值的输入数据框架。该数据框架可以包含来自许多时间序列的信息。使用“unique_id”列来标识数据集中不同的时间序列。
# 从指定的URL读取csv文件,并将其存储在DataFrame中
df = pd.read_csv('https://raw.githubusercontent.com/Nixtla/transfer-learning-time-series/main/datasets/electricity-short.csv')

# 显示DataFrame的前几行数据
df.head()
| unique_id | ds | y | |
|---|---|---|---|
| 0 | BE | 2016-12-01 00:00:00 | 72.00 |
| 1 | BE | 2016-12-01 01:00:00 | 65.80 |
| 2 | BE | 2016-12-01 02:00:00 | 59.99 |
| 3 | BE | 2016-12-01 03:00:00 | 50.69 |
| 4 | BE | 2016-12-01 04:00:00 | 52.58 |
让我们使用StatsForecast来绘制这个系列。
# 调用timegpt模块中的plot函数,并传入df参数
timegpt.plot(df)

我们只需要将数据帧传递给函数,就可以一次性为所有时间序列创建预测。
# 使用timegpt库中的forecast函数对数据进行预测
# 参数df表示输入的数据框
# 参数h表示预测的时间步长,这里设置为24
# 参数level表示置信水平,这里设置为[80, 90]
timegpt_fcst_multiseries_df = timegpt.forecast(df=df, h=24, level=[80, 90])

# 输出预测结果的前几行
timegpt_fcst_multiseries_df.head()
INFO:nixtlats.timegpt:Validating inputs...
INFO:nixtlats.timegpt:Preprocessing dataframes...
INFO:nixtlats.timegpt:Inferred freq: H
INFO:nixtlats.timegpt:Restricting input...
INFO:nixtlats.timegpt:Calling Forecast Endpoint...
| unique_id | ds | TimeGPT | TimeGPT-lo-90 | TimeGPT-lo-80 | TimeGPT-hi-80 | TimeGPT-hi-90 | |
|---|---|---|---|---|---|---|---|
| 0 | BE | 2016-12-31 00:00:00 | 46.151176 | 36.660475 | 38.337019 | 53.965334 | 55.641878 |
| 1 | BE | 2016-12-31 01:00:00 | 42.426598 | 31.602227 | 33.976717 | 50.876478 | 53.250968 |
| 2 | BE | 2016-12-31 02:00:00 | 40.242889 | 30.439966 | 33.634981 | 46.850798 | 50.045813 |
| 3 | BE | 2016-12-31 03:00:00 | 38.265339 | 26.841481 | 31.022096 | 45.508582 | 49.689197 |
| 4 | BE | 2016-12-31 04:00:00 | 36.618801 | 18.541384 | 27.981348 | 45.256255 | 54.696218 |
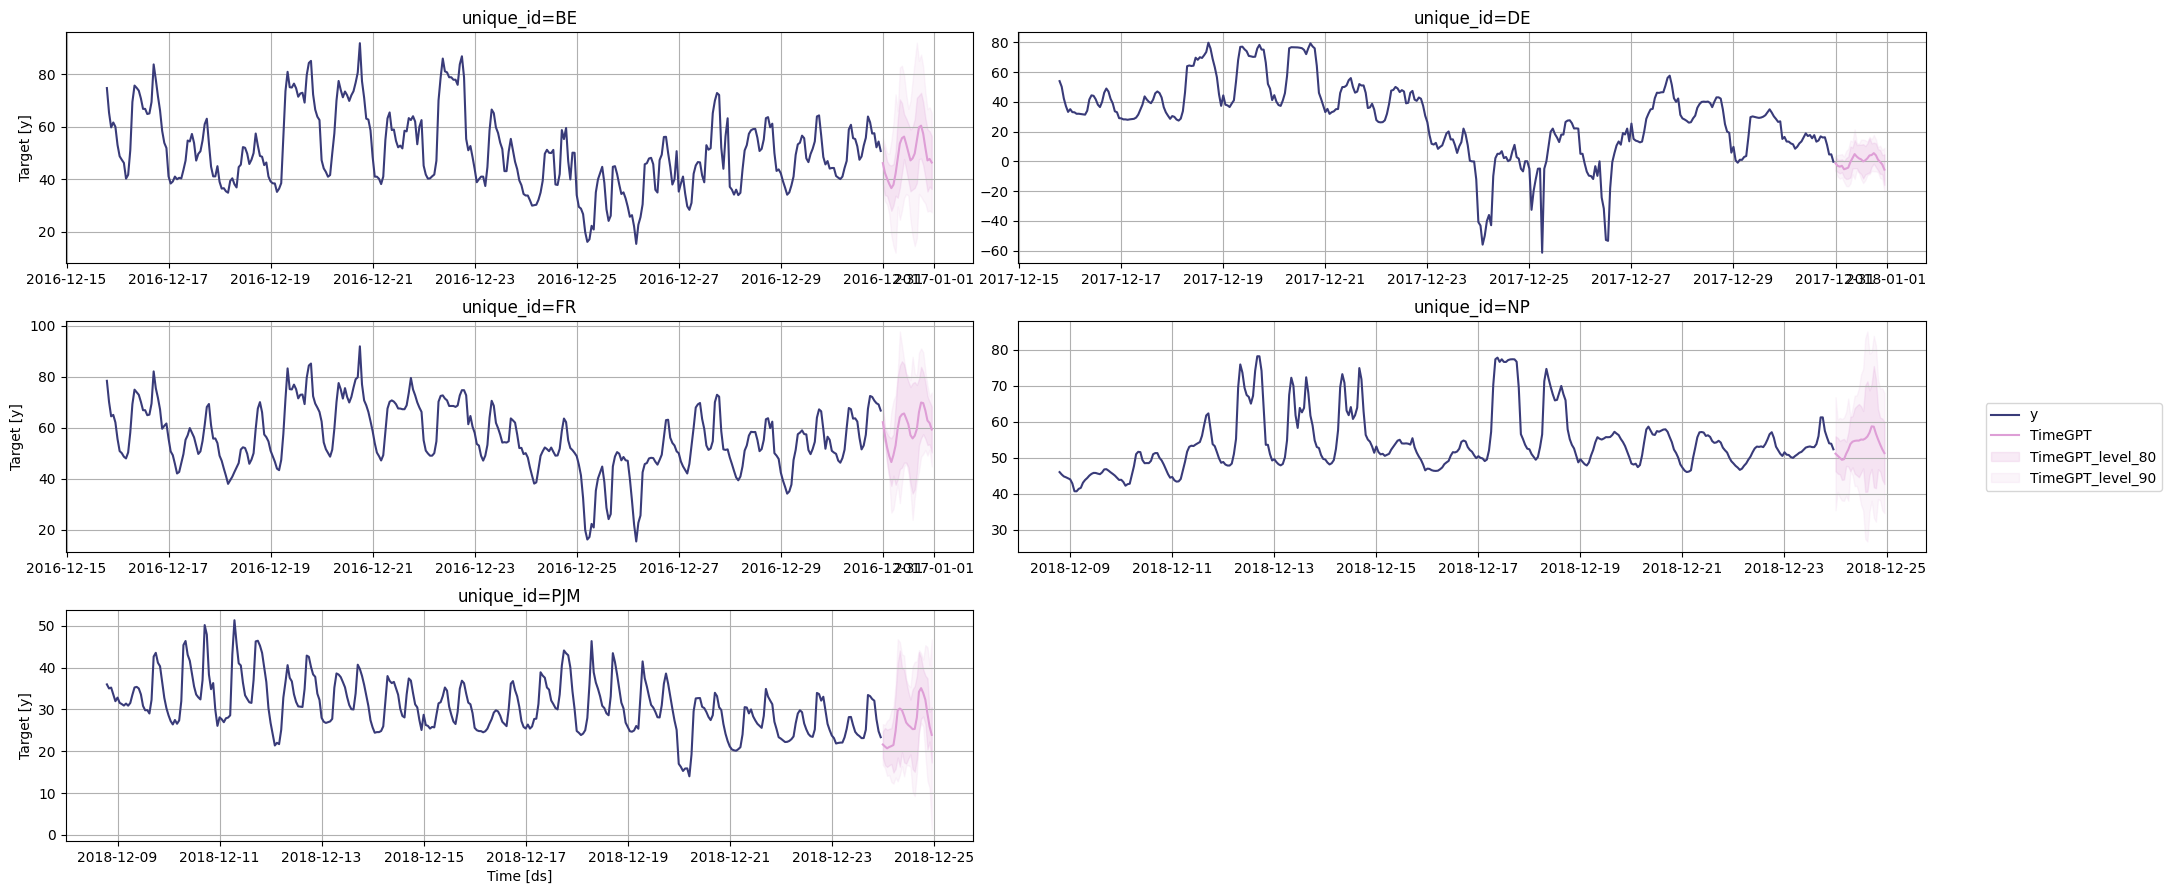
# 绘制时间序列图
timegpt.plot(df, timegpt_fcst_multiseries_df, max_insample_length=365, level=[80, 90])
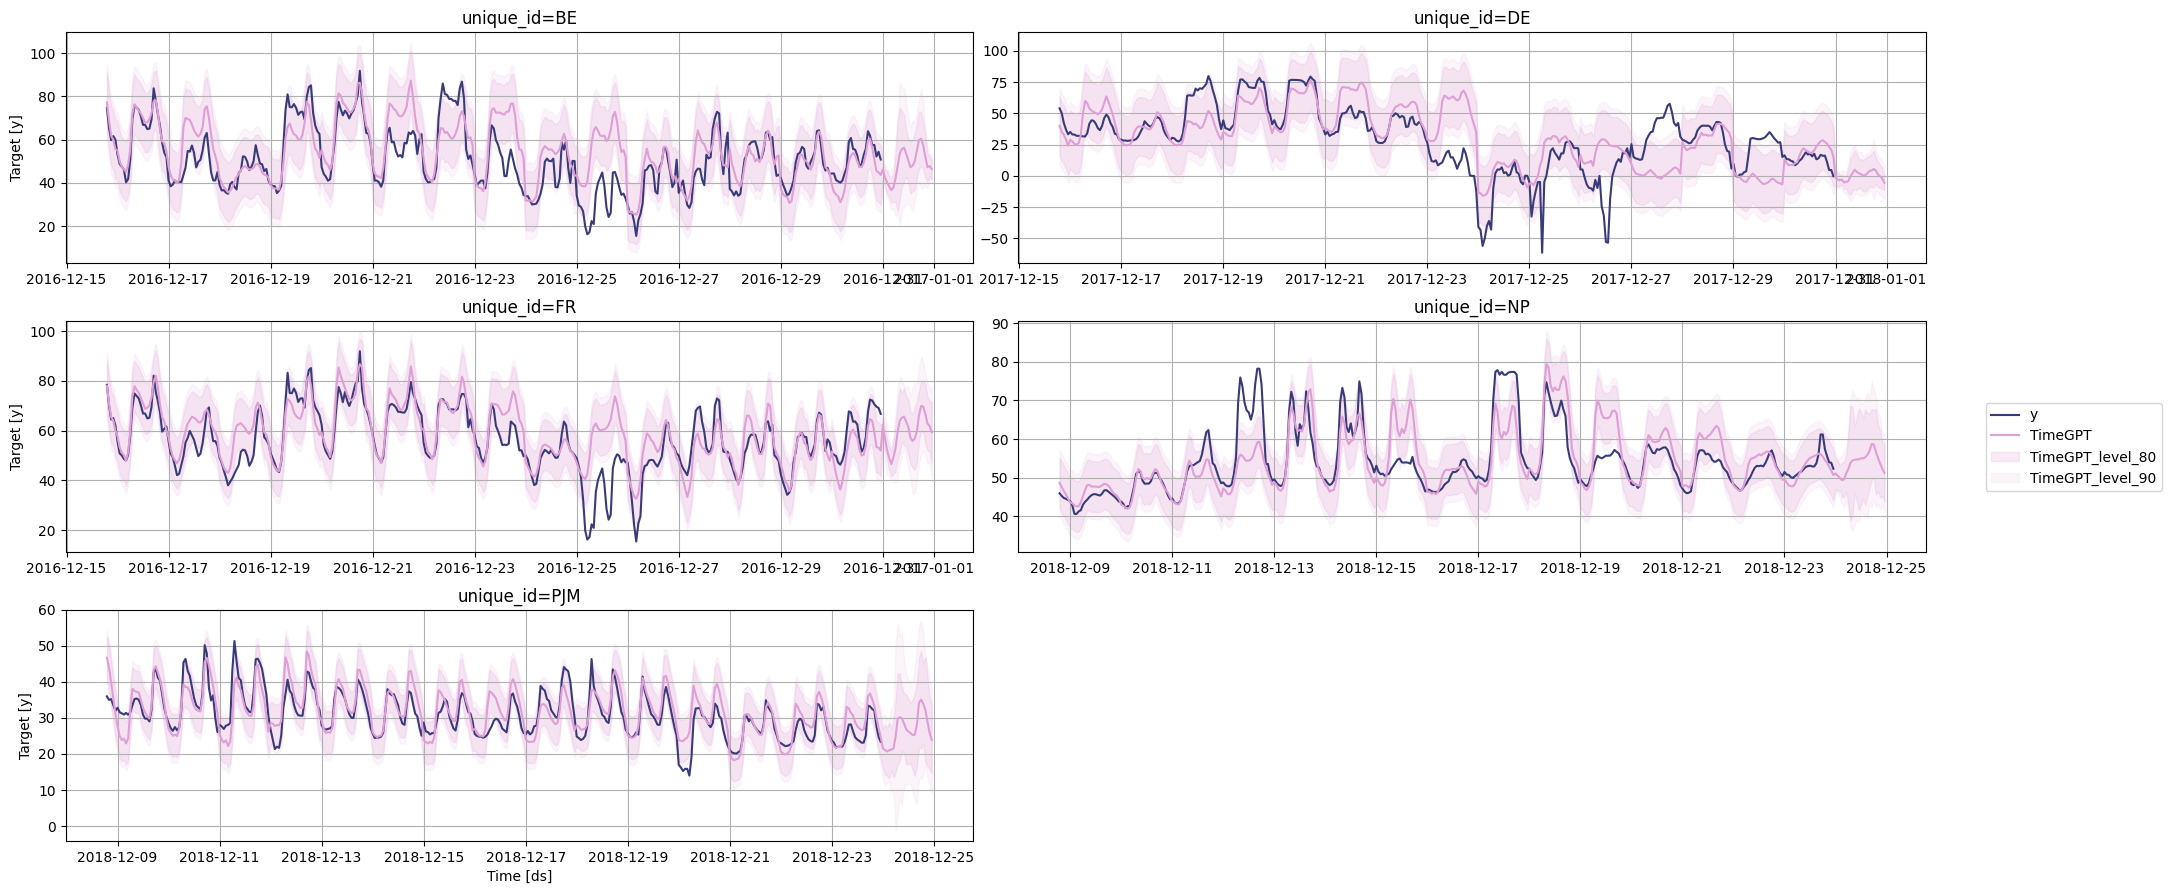
历史预测
您还可以通过添加add_history=True参数来计算历史预测的预测区间。
# 使用timegpt库中的forecast函数对数据进行预测
# 参数df表示输入的数据框
# 参数h表示预测的时间步长,这里设置为24
# 参数level表示置信水平,这里设置为[80, 90]
# 参数add_history表示是否添加历史数据,这里设置为True
timegpt_fcst_multiseries_with_history_df = timegpt.forecast(df=df, h=24, level=[80, 90], add_history=True)

# 打印预测结果的前几行
timegpt_fcst_multiseries_with_history_df.head()
INFO:nixtlats.timegpt:Validating inputs...
INFO:nixtlats.timegpt:Preprocessing dataframes...
INFO:nixtlats.timegpt:Inferred freq: H
INFO:nixtlats.timegpt:Calling Forecast Endpoint...
INFO:nixtlats.timegpt:Calling Historical Forecast Endpoint...
| unique_id | ds | TimeGPT | TimeGPT-lo-80 | TimeGPT-lo-90 | TimeGPT-hi-80 | TimeGPT-hi-90 | |
|---|---|---|---|---|---|---|---|
| 0 | BE | 2016-12-06 00:00:00 | 55.756325 | 42.066469 | 38.185585 | 69.446180 | 73.327064 |
| 1 | BE | 2016-12-06 01:00:00 | 52.820198 | 39.130342 | 35.249458 | 66.510054 | 70.390938 |
| 2 | BE | 2016-12-06 02:00:00 | 46.851078 | 33.161222 | 29.280338 | 60.540934 | 64.421818 |
| 3 | BE | 2016-12-06 03:00:00 | 50.640884 | 36.951029 | 33.070145 | 64.330740 | 68.211624 |
| 4 | BE | 2016-12-06 04:00:00 | 52.420395 | 38.730539 | 34.849655 | 66.110251 | 69.991134 |
# 绘制时间序列图
timegpt.plot(
    df,  # 数据框,包含要绘制的时间序列数据
    timegpt_fcst_multiseries_with_history_df.groupby('unique_id').tail(365 + 24),  # 根据唯一ID分组的数据框,包含历史数据和预测数据
    max_insample_length=365,  # 最大的历史数据长度
    level=[80, 90],  # 置信水平
)
文章来源:https://blog.csdn.net/wjjc1017/article/details/135244172
本文来自互联网用户投稿,该文观点仅代表作者本人,不代表本站立场。本站仅提供信息存储空间服务,不拥有所有权,不承担相关法律责任。 如若内容造成侵权/违法违规/事实不符,请联系我的编程经验分享网邮箱:veading@qq.com进行投诉反馈,一经查实,立即删除!
本文来自互联网用户投稿,该文观点仅代表作者本人,不代表本站立场。本站仅提供信息存储空间服务,不拥有所有权,不承担相关法律责任。 如若内容造成侵权/违法违规/事实不符,请联系我的编程经验分享网邮箱:veading@qq.com进行投诉反馈,一经查实,立即删除!