echarts自定义tooltip位置和内容
2023-12-13 16:31:47
tooltip: {
trigger: 'item',
backgroundColor: 'none',
position: function (pos, params, dom, rect, size) {
//我这个是每次显示30条数据 所以这么判断
var obj = params.dataIndex < 15 ? "right" : "left"
return obj;
},
formatter: (params) => {
//收入和支出是不同颜色 背景 还带个箭头
var str = this.activeNum == 0 ? '收入' : '支出',
bg = this.activeNum == 0 ? '#E2F8EE' : '#FFE0C9',
textColor = this.activeNum == 0 ? '#00A862' : '#F29C00',
//两个箭头 小于15的显示左边的 大于的显示右边的
//这个字符串拼接感觉好麻烦
showLeft = params.dataIndex < 15 ? "block" : "none",
showRight = params.dataIndex < 15 ? "none" : "block"
return '<div style="display:flex;align-items:center;justify-content:space-between;color:' + textColor + '"><div style="display:' + showLeft + '"><b style="content:\'\';display: inline-block;height: 0.08rem;width: 0.08rem;border-top: 0.08rem solid transparent; border-bottom: 0.1rem solid transparent;border-right: 0.1rem solid ' + bg + ';"></b></div><div style="flex:1;border-radius:0.05rem;padding: 0.02rem 0.09rem;background:' + bg + '"><p>' + params.name.split('-')[0] + '月' + params.name.split('-')[1] + '日' + str + '</p><p>' + params.value + '元</p></div><div style="display:' + showRight + '"><b style="content:\'\';display: inline-block;height: 0.08rem;width: 0.08rem;border-top: 0.08rem solid transparent; border-bottom: 0.1rem solid transparent;border-left: 0.1rem solid ' + bg + ';"></b></div></div>';
}
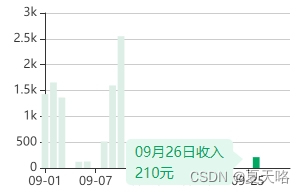
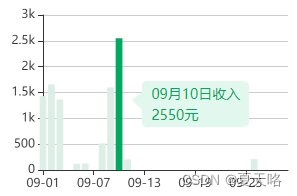
},效果图:
文章来源:https://blog.csdn.net/qq_37628661/article/details/134973846
本文来自互联网用户投稿,该文观点仅代表作者本人,不代表本站立场。本站仅提供信息存储空间服务,不拥有所有权,不承担相关法律责任。 如若内容造成侵权/违法违规/事实不符,请联系我的编程经验分享网邮箱:veading@qq.com进行投诉反馈,一经查实,立即删除!
本文来自互联网用户投稿,该文观点仅代表作者本人,不代表本站立场。本站仅提供信息存储空间服务,不拥有所有权,不承担相关法律责任。 如若内容造成侵权/违法违规/事实不符,请联系我的编程经验分享网邮箱:veading@qq.com进行投诉反馈,一经查实,立即删除!