Echarts水球图
2023-12-29 00:35:11
echart相关好用的搜索链接:
2.series-pie饼图 - makeapie echarts社区图表可视化案例?
5.好用的取色链接:ColorDrop
(以上是四个较为常见的参考链接)
?
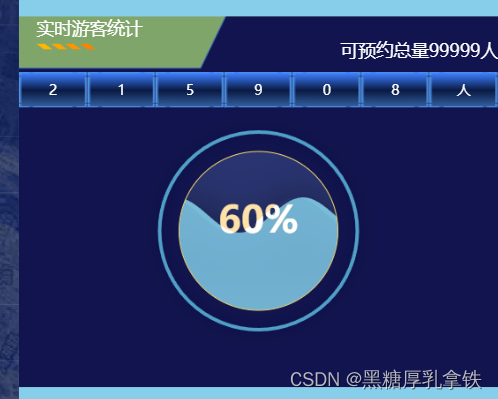
以下是效果图:

?以下是代码部分:
<template>
  <div id="box">
    <div class="top">
      <p class="title">实时游客统计</p>
      <p class="bg"></p>
      <p class="count">可预约总量99999人</p>
    </div>
    <div class="number">
      <span v-for="(item,index) in numArr" :key="index" class="deNum">{{item}}</span>
    </div>
    <div class="pic" ref="liquidfill">pic</div>
  </div>
</template>
<script>
import * as echarts from 'echarts';
import 'echarts-liquidfill'
export default {
  name: "",
  data() {
    return {
      numArr:[2,1,5,9,0,8,"人"]
    };
  },
  methods: {
    drawChart(){
        let myChart = echarts.init(this.$refs.liquidfill);
      myChart.setOption({
      // backgroundColor: '#0F224C',
       //背景色
       series: [
        {
            type: 'liquidFill', //水位图
            radius: '80%', //显示比例
            center: ['50%', '50%'], //中心点
            amplitude: 20, //水波振幅
            data: [0.6,.6], // data个数代表波浪数
            backgroundStyle: {
                borderWidth: 1, //测试貌似是内边框宽度
                 borderColor: '#F7DC6F', //内边框颜色
                color: 'RGBA(51, 66, 127, 0.7)', //边框内部填充部分颜色
            },
            label: {
                //标签设置
                position: ['50%', '45%'],//标签的位置
                formatter: '60%', //显示文本,
                textStyle: {
                    fontSize: '42px', //文本字号,
                    color: '#FFE2A8',//文字的颜色
                },
            },
            outline: {
                show: true,//是否显示外边框
                borderDistance: 20,//外边框到内部边框的距离
                itemStyle: {
                    borderWidth: 4, //外边框的宽度
                    borderColor: '#4F9FC7', //边框颜色
                },
            },
            color: ['#7FC7E2', '#3B5998'], //里面波浪的颜色
            emphasis: {   //鼠标悬浮上去的图形样式
                itemStyle: {
                    opacity: 0.1
                }
            }
        },
    ]
    })
    }
  },
  created() {},
  mounted() {
   this.drawChart()
  },
};
</script>

<style lang="less" scoped>
#box {
  width: 100%;
  height: 100%;
  background: url("@/assets/images/dataScreen-main-lt.png") no-repeat;
  background-size: 100% 100%;
  margin-top: 20px;
  .top {
    margin-left: 20px;
    position: relative;
    .title {
      font-size: 20px;
    }
    .bg {
      width: 68px;
      height: 7px;
      background: url("@/assets/images/dataScreen-title.png") no-repeat;
      background-size: 100% 100%;
      margin-top: 5px;
    }
    .count{
      position: absolute;
      top:25px;
      right:0px;
      font-size: 20px;
    }
  }
  .number{
    display: flex;
    margin-top: 25px;
    .deNum{
      flex:1;
      height:40px;
  background: url("@/assets/images/total.png") no-repeat;
  background-size: 100% 100%;
  text-align: center;
  line-height: 40px;
    }
  }
  .pic{
    height: 280px;
    display: flex;
    justify-content:center;
    align-items: center;
  }
}
</style>
?注意:水球图是插件要下包才能用
注意:如果效果出不来一定要思考是不是水球图的盒子忘记给宽度高度了,如果没有给宽高就是薅秃了皮也出不来图,本人下次不再犯这种bug了。
?
?
文章来源:https://blog.csdn.net/wuqudhen/article/details/135242223
本文来自互联网用户投稿,该文观点仅代表作者本人,不代表本站立场。本站仅提供信息存储空间服务,不拥有所有权,不承担相关法律责任。 如若内容造成侵权/违法违规/事实不符,请联系我的编程经验分享网邮箱:veading@qq.com进行投诉反馈,一经查实,立即删除!
本文来自互联网用户投稿,该文观点仅代表作者本人,不代表本站立场。本站仅提供信息存储空间服务,不拥有所有权,不承担相关法律责任。 如若内容造成侵权/违法违规/事实不符,请联系我的编程经验分享网邮箱:veading@qq.com进行投诉反馈,一经查实,立即删除!