Xgboost分类模型的完整示例
2024-01-01 16:41:20

往期精彩推荐
定义问题
UCI的蘑菇数据集的主要目的是为了分类任务,特别是区分蘑菇是可食用还是有毒。这个数据集包含了蘑菇的各种特征,如帽形、颜色、气味等,以及一个标签表示蘑菇是否有毒。通过对这些特征的分析,可以构建分类模型来预测任何一个蘑菇样本是否有毒。这种类型的任务对于练习数据科学和机器学习技能,尤其是分类算法的应用和理解,非常有帮助。
导入相关库
import pandas as pd
import numpy as np
from sklearn.model_selection import train_test_split
from sklearn.preprocessing import LabelEncoder, StandardScaler
from sklearn.metrics import classification_report
from xgboost import XGBClassifier
from sklearn.model_selection import RandomizedSearchCV
from sklearn.metrics import accuracy_score, precision_score, recall_score, f1_score
import matplotlib.pyplot as plt
import shap
加载数据集
# 数据集的URL
url = "https://archive.ics.uci.edu/ml/machine-learning-databases/mushroom/agaricus-lepiota.data"

# 定义列名
column_names = ["class", "cap-shape", "cap-surface", "cap-color", "bruises", "odor",
                "gill-attachment", "gill-spacing", "gill-size", "gill-color", "stalk-shape",
                "stalk-root", "stalk-surface-above-ring", "stalk-surface-below-ring",
                "stalk-color-above-ring", "stalk-color-below-ring", "veil-type", "veil-color",
                "ring-number", "ring-type", "spore-print-color", "population", "habitat"]

# 加载数据集
mushroom_data = pd.read_csv(url, names=column_names)

# 查看数据集的前几行
mushroom_data.head(5)

数据探索
统计数据可以帮助您快速了解数据的分布情况、中心趋势和离散程度。在数据分析和机器学习的前期阶段,这是一个常用的探索性数据分析(EDA)步骤。
mushroom_data.describe()

数据预处理
去除异常值
# 可以根据均值标准差来定义异常值
均值 ± 3倍标准差  之外的定义为异常值
缺失值填充
mushroom_data = mushroom_data.fillna(0)
数值类型转换
# 将分类数据转换为数值
label_encoder = LabelEncoder()
for column in mushroom_data.columns:
    mushroom_data[column] = label_encoder.fit_transform(mushroom_data[column])
划分训练集与测试集
# 划分训练集和测试集
X = mushroom_data.drop('class', axis=1)
y = mushroom_data['class']
X_train, X_test, y_train, y_test = train_test_split(X, y, test_size=0.3, random_state=42)
均衡采样与模型定义
# 计算正负样本比例,在XGBoost模型中设置scale_pos_weight
scale_pos_weight = sum(y_train == 0) / sum(y_train == 1)

# 定义模型
xgb_model = XGBClassifier(use_label_encoder=False, eval_metric='logloss', scale_pos_weight=scale_pos_weight)
随机搜索选参
定义XGBoost的参数搜索范围,并使用RandomizedSearchCV进行随机搜索,以找到最佳的超参数。
param_distributions = {
    'n_estimators': [100, 300, 500, 800, 1000],  # 表示树的个数。增加树的数量可以提高模型的复杂度,但也可能导致过拟合。
    'learning_rate': [0.01, 0.05, 0.1, 0.15, 0.2],  # 学习率,用于控制每棵树对最终结果的影响。较低的学习率意味着模型需要更多的树来进行训练。
    'max_depth': [3, 4, 5, 6, 7, 8],  # 树的最大深度。更深的树会增加模型的复杂度,但也可能导致过拟合。
    'min_child_weight': [1, 2, 3, 4],  # 决定最小叶子节点样本权重和。较大的值可以防止模型过于复杂,从而避免过拟合。
    'subsample': [0.6, 0.7, 0.8, 0.9, 1.0],  # 用于控制每棵树随机采样的比例,减少这个参数的值可以使模型更加保守,防止过拟合。
    'colsample_bytree': [0.6, 0.7, 0.8, 0.9, 1.0],  # 用于每棵树的训练时,随机采样的特征的比例。减少这个参数的值同样可以防止模型过于复杂。
    'gamma': [0, 0.1, 0.2, 0.3, 0.4]  # 后剪枝时,作为节点分裂所需的最小损失函数下降值。该参数值越大,算法越保守。
}

random_search = RandomizedSearchCV(
    xgb_model, param_distributions, n_iter=50, cv=5, random_state=42
)
random_search.fit(X_train, y_train)

best_params = random_search.best_params_
xgb_model.set_params(**best_params)
模型评估
使用找到的最佳参数训练XGBoost模型,然后在测试集上进行评估,计算性能指标如准确率、精确率、召回率和F1分数。
xgb_model.fit(X_train, y_train)
y_pred = xgb_model.predict(X_test)
# 混淆矩阵
cm = confusion_matrix(y_test, y_pred)
tn, fp, fn, tp = cm.ravel()
accuracy = accuracy_score(y_test, y_pred)
precision = precision_score(y_test, y_pred)
recall = recall_score(y_test, y_pred)
f1 = f1_score(y_test, y_pred)

performance_df = pd.DataFrame({
        'TN': [tn],
        'FP': [fp],
        'FN': [fn],
        'TP': [tp],
        'Accuracy': [accuracy_score(y_test, y_pred)],
        'Precision': [precision_score(y_test, y_pred)],
        'Recall': [recall_score(y_test, y_pred)],
        'F1 Score': [f1_score(y_test, y_pred)]
    })
# 展示模型评估结果
performance_df.head()
标准数据集,结果太完美了,实际数据集就差强人意了

模型特征重要性展示
# 获取特征重要性
feature_importances = xgb_model.feature_importances_

# 可视化特征重要性
plt.style.use("ggplot")
plt.barh(range(len(feature_importances)), feature_importances)
plt.yticks(range(len(X.columns)), X.columns)
plt.xlabel('Feature Importance')
plt.title('Feature Importance in XGBoost Model')
plt.show()

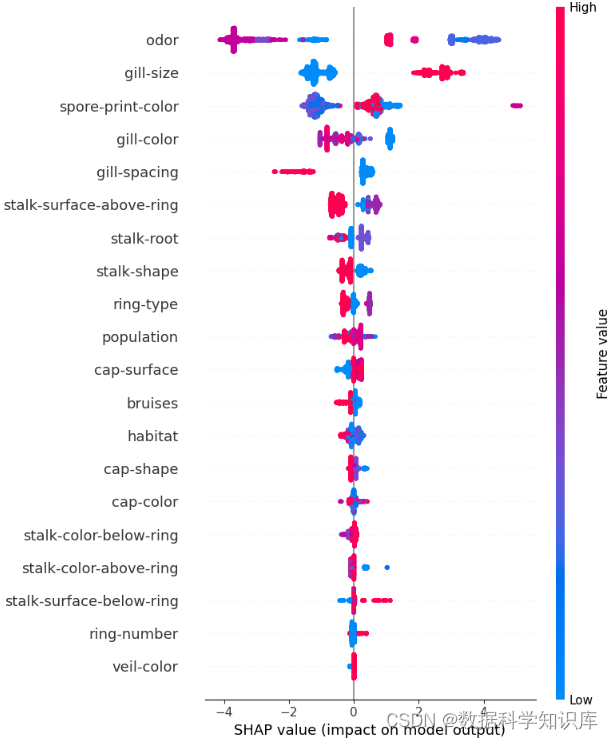
SHAP负例分析
SHAP库提供了多种可视化工具,可以帮助您更深入地了解模型的行为。使用SHAP库计算XGBoost模型的SHAP值,分析被模型错误分类为负例的情况,并通过可视化来理解影响这些预测的关键特征在进行负例分析时,您可以专注于那些被模型错误分类的样本,并使用SHAP值来探究背后的原因。
# 计算SHAP值
explainer = shap.Explainer(xgb_model, X_train)
shap_values = explainer(X_test)

# 可视化:展示单个预测的SHAP值
shap.initjs()
# shap.force_plot(explainer.expected_value, shap_values[0,:], X_test[0,:])

# 可视化:展示所有测试数据的SHAP值
shap.summary_plot(shap_values, X_test)

文章来源:https://blog.csdn.net/weixin_41620184/article/details/135325404
本文来自互联网用户投稿,该文观点仅代表作者本人,不代表本站立场。本站仅提供信息存储空间服务,不拥有所有权,不承担相关法律责任。 如若内容造成侵权/违法违规/事实不符,请联系我的编程经验分享网邮箱:veading@qq.com进行投诉反馈,一经查实,立即删除!
本文来自互联网用户投稿,该文观点仅代表作者本人,不代表本站立场。本站仅提供信息存储空间服务,不拥有所有权,不承担相关法律责任。 如若内容造成侵权/违法违规/事实不符,请联系我的编程经验分享网邮箱:veading@qq.com进行投诉反馈,一经查实,立即删除!