识别低效io引起的free buffer waits
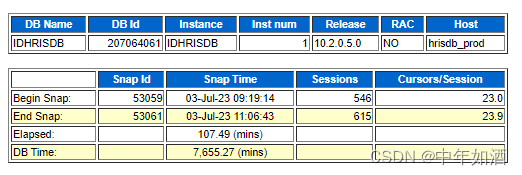
产生事发时间段的awr报告

Top 5 wait events

这里重点关注:
1.free buffer waits
2.enq_HW-contention
3.enq:tx-row lock contention
enq:HW-contention属于水位线的争用,已经透过alter table allocate extent,提前分配空间,这里不做讨论
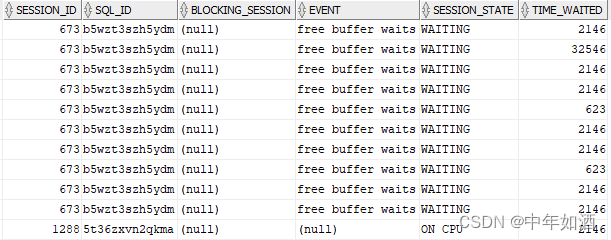
关于enq: TX - row lock contention ,我们透过如下查询得知,是由于free buffer waits引起,所以如果解决了free buffer wait,lock的竞争也将得到改善
select session_id,sql_id,blocking_session,event,session_state,time_waited  from dba_hist_active_sess_history where session_id in (
select blocking_session from dba_hist_active_sess_history
where to_char(SAMPLE_TIME,'YYYY-MM-DD HH24:MI:SS') BETWEEN '2023-07-03 09:00:00' AND '2023-07-03 11:00:00'
and event='enq: TX - row lock contention')

那么,free buffer wait是什么引起的呢?
1.small buffer cache?
2.Inefficient io IO
32.Inefficient io sql statement?
我们先看看几个指标的解释:
1.free buffer requested:
A ‘free buffer requested’ is incremented every time a “new buffer” needs to be
created in the buffer cache. This is typically because a requested block is not in
memory and so needs to be read from disk or because a read consistent block needs to
be created which currently doesn’t exist in memory. A ‘high’ value may suggest either
the cache is too small and blocks are not being found when required in memory or that
much conflicting activity between writes and reads requiring consistent blocks to be
generated in occurring
2.free buffer inspected
A ‘free buffer inspected’ occurs when a block is checked via the LRU list to determine whether it can be overwritten in order to create a new block (to satisfy a free buffer requested). This value is incremented if the ‘inspected’ block may not be overwritten due to the block being ‘dirty’ (or changed) or the block being ‘pinned’ (or currently being accessed). A ‘high’ value may suggest that the db writers are not efficient enough in cleaning out blocks in order to have sufficient free blocks
available.
3.dirty buffers inspected
The dirty buffers inspected Oracle metric is the number of dirty buffers found by the foreground while the foreground is looking for a buffer to reuse.
A dirty buffer is a buffer whose contents have been modified. Dirty buffers are freed for reuse when DBWR has written the blocks to disk.
The database buffer cache is organized in two lists: the write list and the least-recently-used (LRU) list. The write list holds dirty buffers, which contain data that has been modified but has not yet been written to disk. The LRU list holds free buffers, pinned buffers, and dirty buffers that have not yet been moved to the write list. Free buffers do not contain any useful data and are available for use. Pinned buffers are buffers that are currently being accessed.
4.summed dirty queue length
The summed dirty queue length Oracle metric is the sum of the dirty LRU queue length after every write request. Divide by “write requests” to get the average queue length after write completion.
再看看AWR中这几个指标的值

这几个值反映,系统经历了
1.高的free buffer inspected,说明系统为了获得free buffer,频繁检查LRU list
2.高的free buffer requested,说明系统有大量的free buffer需求
3.高的dirty buffers inspected, 说明频繁检查LRU时,检查到大量的dirty buffer
4.高的summed dirty queue,说明write list超级长
系統io情況:
[oracle10g@EDI:~$ vmstat 1 20
procs -----------memory---------- ---swap-- -----io---- -system-- ------cpu-----
 r  b   swpd   free   buff  cache   si   so    bi    bo   in   cs us sy id wa st
 1 15  51968 168912   8524 12972824    0    0   894   206    0    1 22  3 70  5  0
 3 12  51968 180556   8524 12967672    0    0 37032   152 4460 5376 23  8 12 57  0
 1 13  51968 174148   8532 12981820    0    0 14248  1304 4135 4571 19  5  7 69  0
 3 14  51968 171000   8528 12966028    0    0 11828   576 3190 2438 33 10  2 56  0
 1 13  51968 173672   8528 12981628    0    0 65324    88 5495 7496 20 11  5 64  0
 0 15  51968 197608   8528 12960552    0    0 18904   480 2735 3008 15  5  9 71  0
 2 14  51968 172060   8524 12968832    0    0 16928   160 2821 2766 15  5  4 76  0
 3 13  51968 180464   8520 12964840    0    0 34532  1416 3672 3248 31 12  9 48  0
[oracle10g@EDI:~$ iostat -x 1 20
avg-cpu:  %user   %nice %system %iowait  %steal   %idle
          59.68    0.00    3.60   30.27    0.00    6.45

Device            r/s     w/s     rkB/s     wkB/s   rrqm/s   wrqm/s  %rrqm  %wrqm r_await w_await aqu-sz rareq-sz wareq-sz  svctm  %util
sdb            934.00   38.00  17264.00    908.00     7.00    15.00   0.74  28.30   14.01   97.79  12.12    18.48    23.89   1.03 100.00
sda              0.00    0.00      0.00      0.00     0.00     0.00   0.00   0.00    0.00    0.00   0.00     0.00     0.00   0.00   0.00
上面的输出反映sdb仅有17264kb/s的读写能力,硬盘latancy 14.01 millisecond也不是正常值,rareq-size请求队列达达到18.48的高值
结合awr报告中free buffer requested,free buffer inspected、dirty buffers inspected、summed dirty queue说明系统由于io的影响,导致刷脏能力很弱,无法产生足够的free buffer满足free buffer request的需求。
由于此台主机属于vmware esxi虚拟机,迁移到io状况良好的其他虚拟机后,free buffer wait消失
本文来自互联网用户投稿,该文观点仅代表作者本人,不代表本站立场。本站仅提供信息存储空间服务,不拥有所有权,不承担相关法律责任。 如若内容造成侵权/违法违规/事实不符,请联系我的编程经验分享网邮箱:veading@qq.com进行投诉反馈,一经查实,立即删除!