TPE-800 PadZ SERIES Integration Guide
- Introduction.
This guide covers Tangio’s TPE-800 standard 3D Single-Touch Resistive PadZ sensors. These sensors simultaneously report single-touch “X-Y” position and variable force “Z”, be that a human finger, passive stylus
or machine interface. Using proven 4-wire technology TPE-800 o ers a compelling touch solution in rugged applications or those requiring gloved hand use or deployment under a metallic top surface.
Interfacing to TPE-800 is simple and can be achieved using two dedicated GPIO microcontroller pins and 2 ADCs.

- Scope
This guide provides all necessary technical information for the successful integration and interfacing of the
TPE-800 3D Single-Touch Resistive Pads into applications such as:
? Computer peripherals and gaming
? Rugged handhelds and notebooks
? Industrial and medical front panels
? Musical instruments
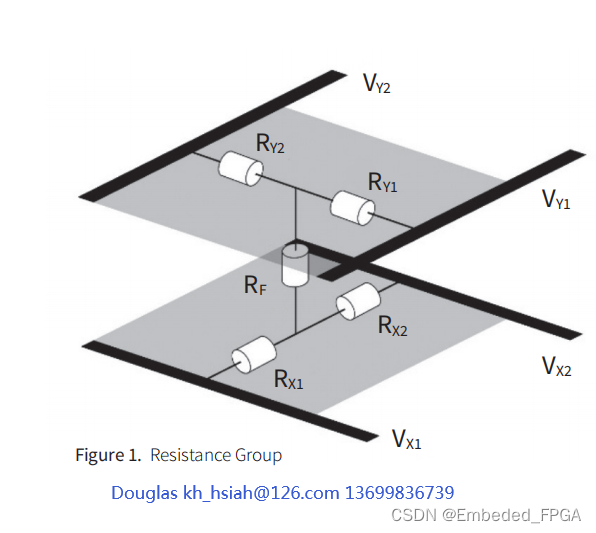
- General Construction
Figure 1 shows the major resistance groups in TPE-800. RF is the contact resistance between the two resistive layers when force is applied to the sensor. The actual values of RX1, RX2, RY1, and RY2 depend on the location of applied force.
Note: Measuring the linear resistances between Y1 and Y2 (RY1 and RY2) and X1 and X2 (RX1 and RX2) is recommended to check the current being passed through the sensor. According to your system, this current may vary and in case that it exceeds the rated current for microcontroller unit of the system, current limiting resistors (100-300 ?) can be used.
4 Schematic of the System
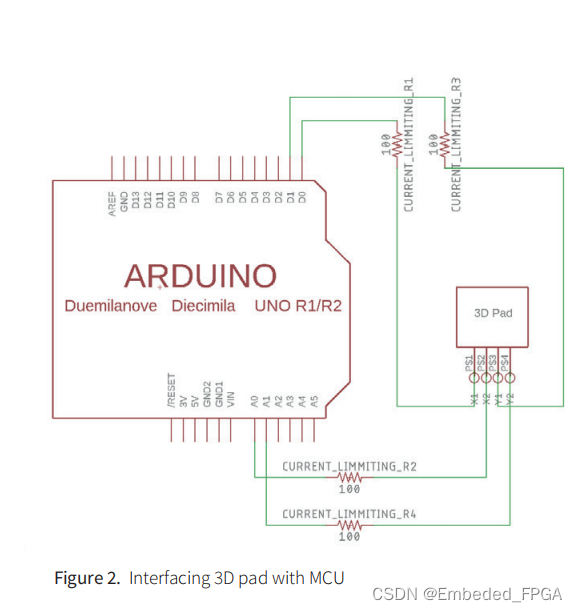
For best results an Arduino or similar microcontroller with an analog to digital converter (ADC) module can be
used to measure the position (X-Y) and relative force (Z) of touch. Figure 2 is an example schematic of a typical
TPE-800 implementation for measuring position & force. The sensor pins are connected to the microcontroller as
follows:
? X1 – Digital pin
? X2 – ADC pin AX2
? Y1 – Digital pin
? Y2 – ADC pin AY2
- Position measure
To measure the X and Y location of touch, the following steps should be followed:
5.1 X Position
The X position of an applied force can be measured in a way similar measuring the position of a potentiometer.
- Setup X1 as an output pin on the microcontroller and make it output a digital HIGH signal.
- Setup X2 as an output pin on the microcontroller and make it output a digital LOW signal.
- Setup Y1 and Y2 as input pins (ensuring that no current flows through those pins).
- Take an ADC measurement, AY2, on pin Y2:
a. If AY2 is closer to 0 then it means that the force was applied closer to the X2 pin side of the XYZ pad.
b. If AY2 is closer to ADCMAX then the force was applied closer to the X1 pin side of the XYZ pad.
5.2 Y Position
The Y position of an applied force can be measured in a way similar measuring the position of a potentiometer. - Setup Y1 as an output pin on the microcontroller and make it output a digital HIGH signal.
- Setup Y2 as an output pin on the microcontroller and make it output a digital LOW signal.
- Setup X1 and X2 as input pins (ensuring that no current flows through those pins).
- Take an ADC measurement, AX2, on pin X2:
a. If AX2 is closer to 0 then it means that the force was applied closer to the Y2 pin side of the XYZ pad.
b. If AX2 is closer to ADCMAX then the force was applied closer to the Y1 pin side of the XYZ pad.
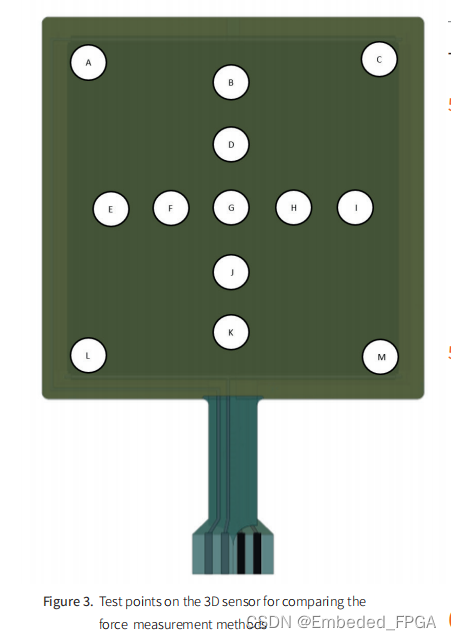
6 Force Measurement
The following subsections describe 3 methods for measuring force. Each method presents compromises which will be discussed later. The preferred method should be selected according to the application. Each of the force measurement methods introduced in this document has been tested on TPE-800 at several test points, and the results are presented as plots. Figure 3 shows test point locations.
6.1 Method 1
The force being applied on the sensor is inversely proportional to the value of RF. So, the force can be estimated by measuring RF.
-
Setup X1 as an output pin on the microcontroller and make it output a digital HIGH signal.
-
Setup Y1 as an output pin on the microcontroller and make it output a digital LOW signal.
-
Setup X2 and Y2 as input pins
-
Take an ADC measurement, AX2, on pin X2
-
Take an ADC measurement, AY2, on pin Y2
-
Calculate the relative force being applied using the following formula:
Force = AX2 – AY2
Figure 4 shows the result of this method on an actual 3D sensor at several test points.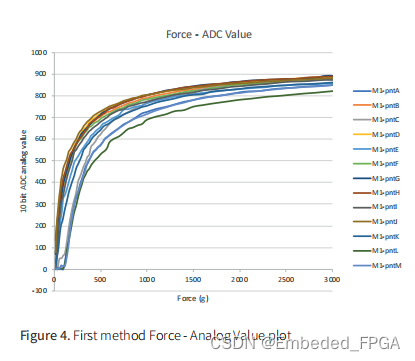
6.2 Method 2
Method 2 follows the same principle as Method 1 except that it reads values from the two opposite edges of
the sensor and calculates the force as the average of these values. The following steps should be followed to
implement this method: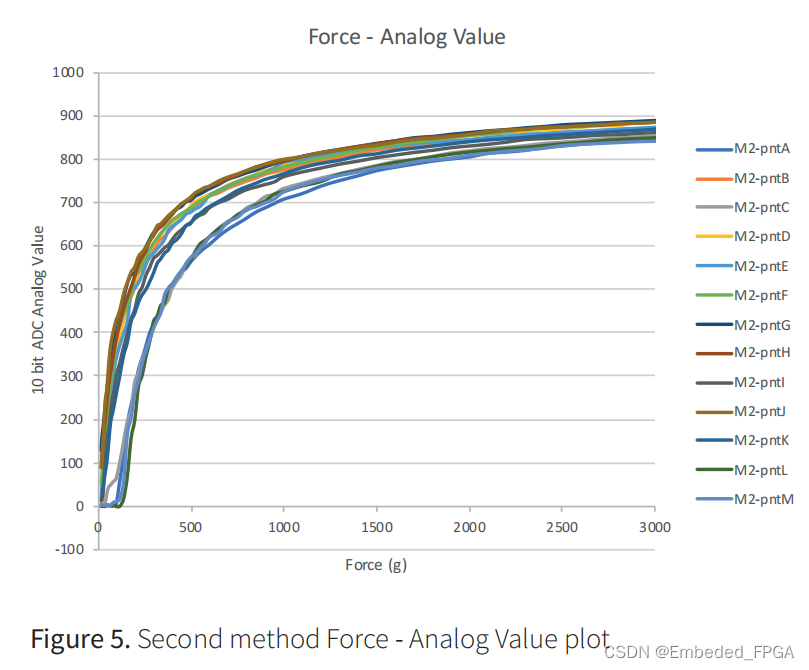
-
Setup X1 as an output pin on the microcontroller and make it output a digital HIGH signal.
-
Setup Y1 as an output pin on the microcontroller and make it output a digital LOW signal.
-
Setup X2 and Y2 as input pins
-
Take an ADC measurement, AX2, on pin X2
-
Take an ADC measurement, AY2, on pin Y2
-
Calculate the first reading using the following formula:
Value1 = AX2 – AY2 -
Setup X2 as an output pin on the microcontroller and make it output a digital HIGH signal.
-
Setup Y2 as an output pin on the microcontroller and make it output a digital LOW signal.
-
Setup X2 and Y2 as input pins
-
Take an ADC measurement, AX1, on pin X1
-
Take an ADC measurement, Ay1, on pinY1
-
Calculate the second reading using the following formula:
Value2 = AX1 – AY1 -
Calculate the force as the average between Value1 and Value2
Figure 5 shows the result of this method on a 3D sensor at the test points described earlier.
6.3 Method 3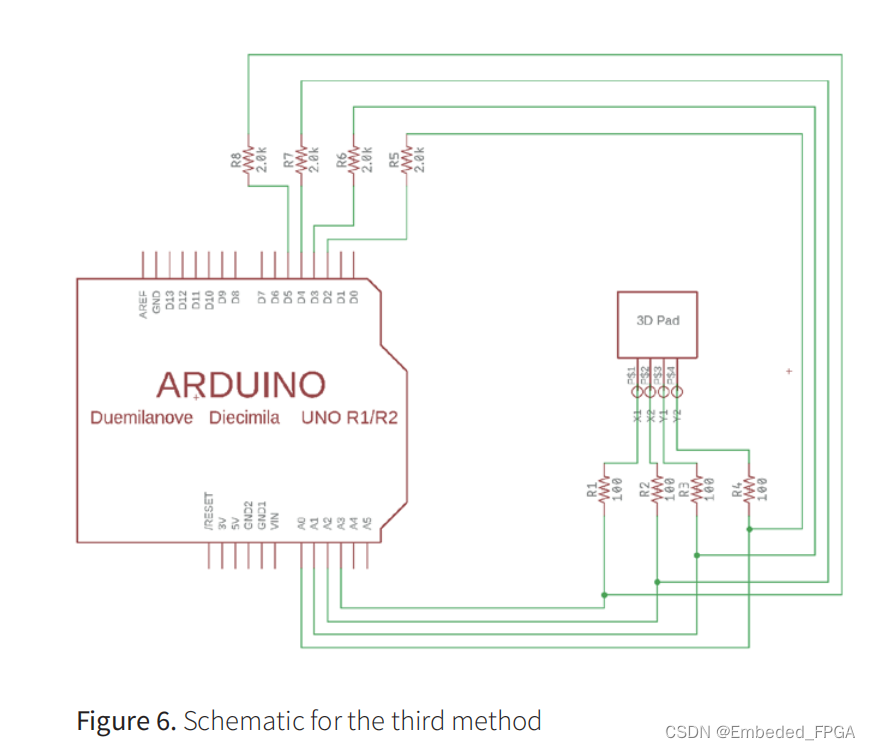
The third method employs extra hardware for improved results. This method needs 2 additional GPIO pins
and 2 additional ADCs which will be used as virtual grounds and measurement pins, as well as 4 extra resistors
(Resistors in the range of 1 K? to 5K? are suggested). Figure 6 shows the circuit diagram of this method, using
an Arduino as the microcontroller unit.
The strategy behind this method is to drive one of the drive lines in the bottom layer high and treat the drive
lines in the top layer as wipers. The voltage on each of these top layer drive lines will be measured using ADC
when the virtual ground relating to that pin is low. The same process will then be repeated with drive lines in
the bottom layer as wipers. At the end the average of all four measured values will be taken. The following steps
should be followed to implement this method:
- Setup X1 as an output pin on the microcontroller and make it output a digital HIGH signal.
- Setup Y1 as an input pin
- Setup D3 (virtual ground relating to Y1) as an output pin and make it output digital LOW signal
- Setup pins D2, D4, D5, X2 and Y2 as input pins.
- Take an ADC measurement, AY1, on pin Y1 and call it value1
- Setup Y2 as an input pin
- Setup D2 (virtual ground relating to Y2) as an output pin and make it output digital LOW signal
- Setup pins D3, D4, D5, X2 and Y1 as input pins.
- Take an ADC measurement, AY2, on pin Y2 and call it value2
- Setup Y1 as an output pin on the microcontroller and make it output a digital HIGH signal.
- Setup X1 as an input pin
- Setup D5 (virtual ground relating to X1) as an output pin and make it output digital LOW signal
- Setup pins D2, D4, D3, X2 and Y2 as input pins.
- Take an ADC measurement, AX1, on pin X1 and call it value3
- Setup X2 as an input pin
- Setup D4 (virtual ground relating to X2) as an output pin and make it output digital LOW signal
- Setup pins D2, D3, D5, X1 and Y2 as input pins.
- Take an ADC measurement, AX2, on pin X2 and call it value2
- Take the average of value1, value2, value3 and value4 which will represent the force on the 3D sensor
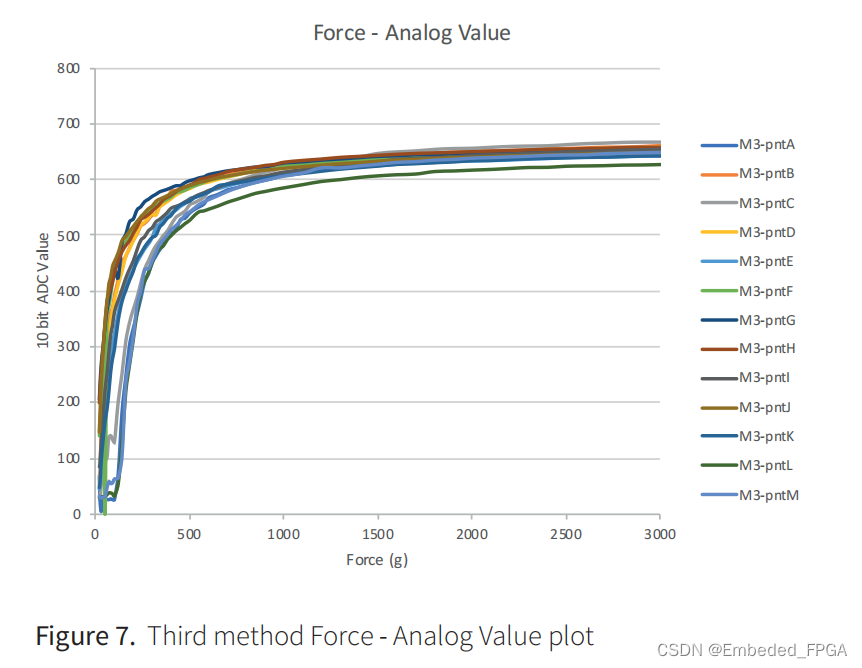
Figure 7 shows the result of this method on an actual 3D sensor at the test points.
6.4 Advantages and Disadvantages
? Method 1 is the simplest to implement. Using only two GPIO and 2 ADC pins, it also requires the minimum hardware. This method achieves low noise characteristics without filtering or averaging leaving system
processing power free for other tasks. However, force measurements are not as consistent at different locations on the sensor as indicated by the shi ed curves in Figure 4.
? Method 2 is a compromise between Method 1 and Method 3. It improves the consistency of the force
measurements in Method 1 without additional hardware or system resources. Comparing Figures 4 and 5,
we can see that force curves resulting from Method 2 are more consistent and closer grouped. While this
method doesn’t need extra hardware it uses more processing power due to the additional measurement and averaging.
? Method 3 further improves the consistency of force measurements. This method also increases the sensitivity of the sensor resulting in a lower activation force (around 25g typical). However, this method is the most complex and needs 2 extra GPIO and ADC pins (4 of each in total) and 4 extra resistors. Furthermore, the algorithm for this method takes more processing system resources, is slower and
generally more complex to implements than the other two.
本文来自互联网用户投稿,该文观点仅代表作者本人,不代表本站立场。本站仅提供信息存储空间服务,不拥有所有权,不承担相关法律责任。 如若内容造成侵权/违法违规/事实不符,请联系我的编程经验分享网邮箱:veading@qq.com进行投诉反馈,一经查实,立即删除!