js highcharts图表控件
2024-01-07 19:50:29
Highcharts是国外的一款功能强大、开源、美观、图表丰富、兼容绝大多数浏览器的纯js图表库
一、新建项目:HchartDemo

二、引入js
<script src="~/lib/jquery/dist/jquery.min.js"></script>
<script src="~/lib/hchart/highcharts.js"></script>
<script src="~/lib/hchart/exporting.js"></script>
完整代码:
@{
ViewData["Title"] = "Home Page";
Layout = null;
}
<script src="~/lib/jquery/dist/jquery.min.js"></script>
<script src="~/lib/hchart/highcharts.js"></script>
<script src="~/lib/hchart/exporting.js"></script>
<script type="text/javascript">
var chart = null;
$.getJSON('https://data.jianshukeji.com/jsonp?filename=json/usdeur.json&callback=?', function (data) {
chart = Highcharts.chart('container', {
chart: {
zoomType: 'x'
},
title: {
text: '美元兑欧元汇率走势图'
},
subtitle: {
text: document.ontouchstart === undefined ?
'鼠标拖动可以进行缩放' : '手势操作进行缩放'
},
xAxis: {
type: 'datetime',
dateTimeLabelFormats: {
millisecond: '%H:%M:%S.%L',
second: '%H:%M:%S',
minute: '%H:%M',
hour: '%H:%M',
day: '%m-%d',
week: '%m-%d',
month: '%Y-%m',
year: '%Y'
}
},
tooltip: {
dateTimeLabelFormats: {
millisecond: '%H:%M:%S.%L',
second: '%H:%M:%S',
minute: '%H:%M',
hour: '%H:%M',
day: '%Y-%m-%d',
week: '%m-%d',
month: '%Y-%m',
year: '%Y'
}
},
yAxis: {
title: {
text: '汇率'
}
},
legend: {
enabled: false
},
plotOptions: {
area: {
fillColor: {
linearGradient: {
x1: 0,
y1: 0,
x2: 0,
y2: 1
},
stops: [
[0, new Highcharts.getOptions().colors[0]],
[1, new Highcharts.Color(Highcharts.getOptions().colors[0]).setOpacity(0).get('rgba')]
]
},
marker: {
radius: 2
},
lineWidth: 1,
states: {
hover: {
lineWidth: 1
}
},
threshold: null
}
},
series: [{
type: 'area',
name: '美元兑欧元',
data: data
}]
});
});
</script>
<div class="text-center">
<div id="container" style="min-width:400px;height:400px"></div>
<div id="container2" style="min-width:400px;height:400px"></div>
</div>
<script type="text/javascript">
Highcharts.chart('container2', {
chart: {
plotBackgroundColor: null,
plotBorderWidth: null,
plotShadow: false,
type: 'pie'
},
title: {
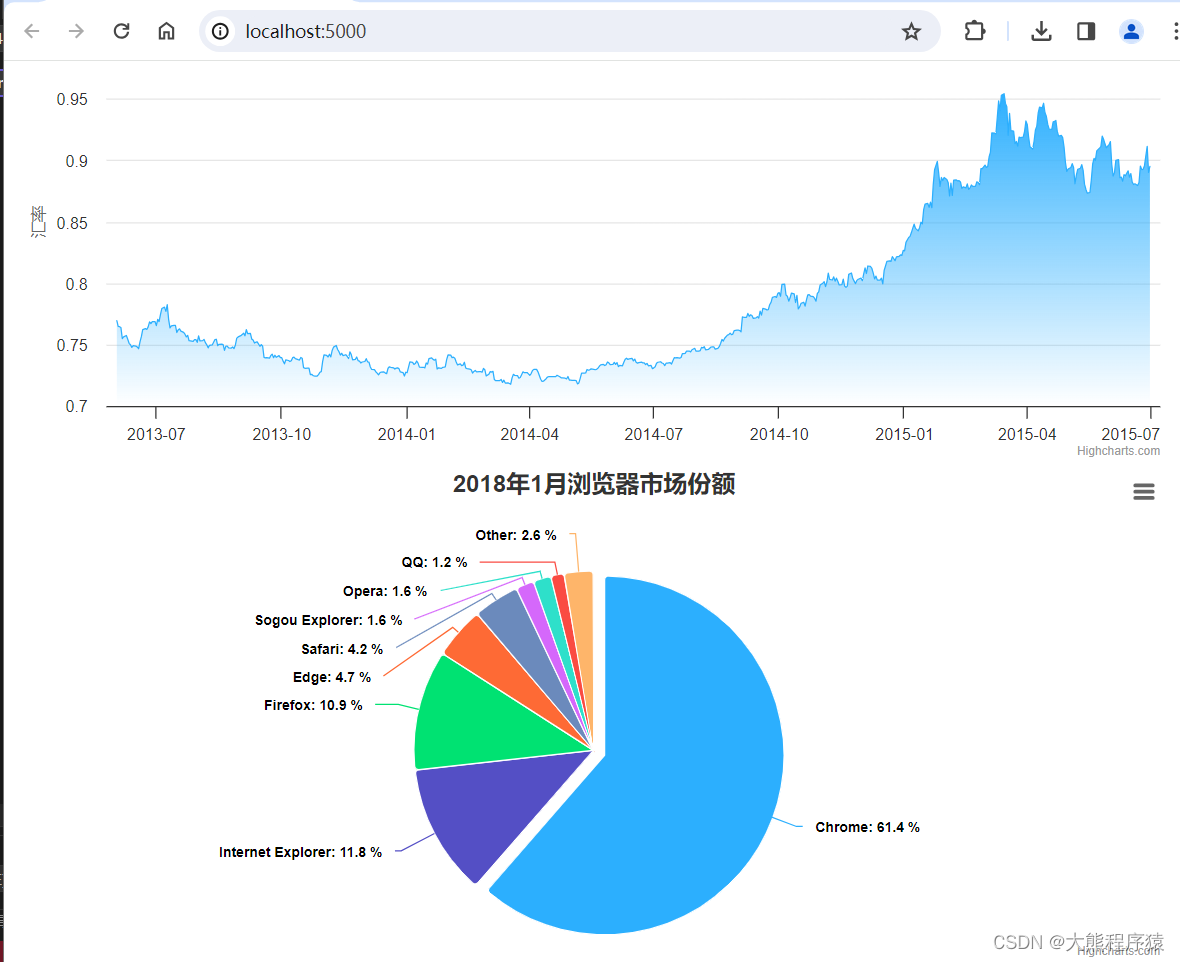
text: '2018年1月浏览器市场份额'
},
tooltip: {
pointFormat: '{series.name}: <b>{point.percentage:.1f}%</b>'
},
plotOptions: {
pie: {
allowPointSelect: true,
cursor: 'pointer',
dataLabels: {
enabled: true,
format: '<b>{point.name}</b>: {point.percentage:.1f} %',
style: {
color: (Highcharts.theme && Highcharts.theme.contrastTextColor) || 'black'
}
}
}
},
series: [{
name: 'Brands',
colorByPoint: true,
data: [{
name: 'Chrome',
y: 61.41,
sliced: true,
selected: true
}, {
name: 'Internet Explorer',
y: 11.84
}, {
name: 'Firefox',
y: 10.85
}, {
name: 'Edge',
y: 4.67
}, {
name: 'Safari',
y: 4.18
}, {
name: 'Sogou Explorer',
y: 1.64
}, {
name: 'Opera',
y: 1.6
}, {
name: 'QQ',
y: 1.2
}, {
name: 'Other',
y: 2.61
}]
}]
});
</script>三、运行效果:
下载地址:https://download.csdn.net/download/xiaoxionglove/88709185
文章来源:https://blog.csdn.net/xiaoxionglove/article/details/135422791
本文来自互联网用户投稿,该文观点仅代表作者本人,不代表本站立场。本站仅提供信息存储空间服务,不拥有所有权,不承担相关法律责任。 如若内容造成侵权/违法违规/事实不符,请联系我的编程经验分享网邮箱:veading@qq.com进行投诉反馈,一经查实,立即删除!
本文来自互联网用户投稿,该文观点仅代表作者本人,不代表本站立场。本站仅提供信息存储空间服务,不拥有所有权,不承担相关法律责任。 如若内容造成侵权/违法违规/事实不符,请联系我的编程经验分享网邮箱:veading@qq.com进行投诉反馈,一经查实,立即删除!