echarts柱状图加单位,底部文本溢出展示
2024-01-08 19:31:43
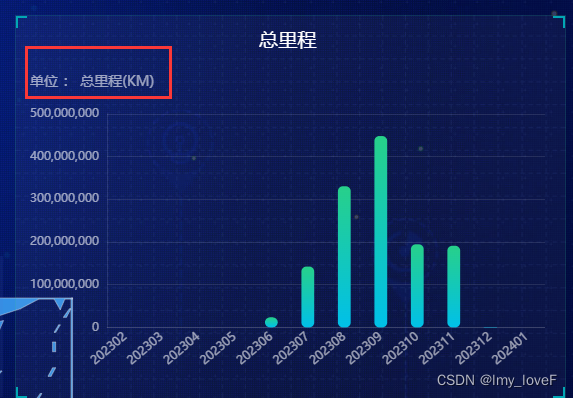
刚开始设置了半天都不展示单位,后来发现是被挡住了,需要调高top值
// 基于准备好的dom,初始化echarts实例
    var myChart = echarts.init(document.getElementById("echartD"));

    rankOption = {
      //  backgroundColor: '#00265f',
      tooltip: {
        trigger: "axis",
        axisPointer: {
          type: "shadow"
        }
      },

      grid: {
        left: "0%",
        top: "50px",//增加这个值
        right: "0%",
        bottom: "2%",
        containLabel: true
      },
yAxis: [
{
name: "单位 : 总里程(KM)",
nameTextStyle: {
color: "rgba(255,255,255,.6)",
fontSize: 14,
padding: [0, 0, 10, -30] //name文字位置 对应 上右下左
}, axisLine: {
show: true,
lineStyle: {
color: "rgba(255,255,255,.1)",
width: 1,
type: "solid"
}
},
axisTick: {
show: false
},
axisLabel: {
interval: 0,
rotate: 40,
show: true,
splitNumber: 15,
textStyle: {
color: "rgba(255,255,255,.6)",
fontSize: "12"
}
}
文章来源:https://blog.csdn.net/lmy_loveF/article/details/135462515
本文来自互联网用户投稿,该文观点仅代表作者本人,不代表本站立场。本站仅提供信息存储空间服务,不拥有所有权,不承担相关法律责任。 如若内容造成侵权/违法违规/事实不符,请联系我的编程经验分享网邮箱:veading@qq.com进行投诉反馈,一经查实,立即删除!
本文来自互联网用户投稿,该文观点仅代表作者本人,不代表本站立场。本站仅提供信息存储空间服务,不拥有所有权,不承担相关法律责任。 如若内容造成侵权/违法违规/事实不符,请联系我的编程经验分享网邮箱:veading@qq.com进行投诉反馈,一经查实,立即删除!