echarts pie饼图样式
2023-12-20 03:01:57
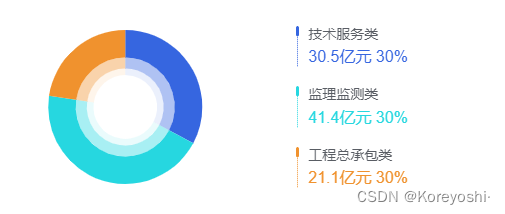
左边饼图是echarts完成,右边的图例是div写的,因为图例的样式没法用legend的样式完成到这样
主页面Html:
<div class="chartHeight" style="position: relative;">
  <pieChartContract :opt="contractStatics" />
  <div class="contractLegend">
    <div v-for="item,index in contractStatics.seriesData" :key="index" class="contractLegendItem" :style="'border-left: 1px dotted '+ color[index]">
      <div class="dashed" :style="'background:' + color[index]"></div>
      <div>{{ item.name }}</div>
      <div class="contractLegendData" :style="'color:'+ color[index]">{{ item.value }}亿元 30%</div>
    </div>
  </div>
</div>
.chartHeight{
  width: 100%;
  height: 220px;
}
.contractLegend{
  position: absolute;
  left: 60%;
  top: 50%;
  transform: translateY(-50%);
}
.contractLegendItem{
  font-size: 14px;
  margin-bottom: 20px;
  color: #595D64;
  text-indent: 10px;
  position: relative;
  justify-content: flex-start;

}
.contractLegendItem:last-child{
  margin-bottom: 0;
}
.contractLegendItem .dashed{
  content: "";
  position: absolute;
  top: 0;
  left: -2px;
  width: 3px;
  height: 10px;
  opacity: 1;
  border-radius: 5px;
}
.contractLegendData{
  font-size: 16px;
  text-align: left;
  margin-top: 6px;
}
主页面js:
data() {
return {
	contractStatics: {
        seriesData: [{
          name: '技术服务类',
          value: 30.5,
          itemStyle: {
            color: '#3562D4',
          },
        },
        {
          name: '监理监测类',
          value: 41.4,
          itemStyle: {
            color: '#2BC4CD',
          },
          },
        {
          name: '工程总承包类',
          value: 21.1,
          itemStyle: {
            color: '#E68B29',
          },
        }],
      },
}
}
// 组件pieChartContract 引入:
import pieChartContract from "./components/pieChartContract";
pieChartContract.vue组件全部:
<template>
  <div style="width: 100%;height: 100%;">
    <ChartPanel ref="chart" :option="options" :style="opt.yAxisName ? 'height:calc(100% - 16px)' : ''"></ChartPanel>
  </div>
</template>

<script>
import * as echarts from 'echarts'
import ChartPanel from '@/components/ChartPanel';
export default {
  components: {
    ChartPanel
  },
  props: {
    opt: {
      type: Object,
      default() {
        return {}
      }
    }
  },
  data() {
    return {
      options: null
    }
  },
  watch: {
    opt: {
      deep: true,
      immediate: true,
      handler(val) {
        // if (val && val.seriesData) {
          this.getOpt(val)
        // }
      }
    }
  },
  methods: {
    getOpt(val) {
      let {
        seriesData,
      } = val
      let seriesData1 = []
      let seriesData2 = []
      let seriesData3 = []
      let color = ['#3666E0', '#26D7E0', '#F0922E']
      seriesData.forEach((item, index) => {
        seriesData1.push({
          ...item,
          itemStyle: {
            color: color[index],
            opacity: 1
          }
        })
        seriesData2.push({
          ...item,
          itemStyle: {
            color: color[index],
            opacity: 0.4
          }
        })
        seriesData3.push({
          ...item,
          itemStyle: {
            color: color[index],
            opacity: 0.1
          }
        })
      })
      this.options = {
        legend: {
          orient: 'vertical',
          show: false,
          left: '60%',
          y: 'center',
          itemWidth: 1,
          itemHeight: 32,
          itemGap: 20,
          textStyle: {
            color: '#595D64',
            fontSize: 14,
            lineHeight: 20,
            rich: {
              percent0: {
                color: color[0],
                fontSize: 16,
              },
              percent1: {
                color: color[1],
                fontSize: 16,
              },
              percent2: {
                color: color[2],
                fontSize: 16,
              }
            },
          },
          formatter: name => {
            let dataIndex = 0
            let obj = (seriesData.filter((item, index) => {
              if (item.name == name) {
                dataIndex = index
                return item
              }
            }))[0]
            return obj.name + '\r\n{percent' + dataIndex + '|' + obj.value + '亿元} ' +
              ' {percent' + dataIndex + '|30%}'
          },
        },
        tooltip: {
          show: true,
          borderWidth: 0,
          formatter: params => {
            let result = `<div style="font-weight:700">${params.name}</div>
                          <div>
                            <span style="color:${params.color};font-weight:700">${params.value}亿元 ${params.percent}%</span>
                          </div>
            `
            return result
          }
        },
        series: [
          {
            type: 'pie',
            radius: ['45%', '70%'],
            center: ['25%', '50%'],
            hoverAnimation: false,
            z: 10,
            label: {
              show: false,
            },
            data: seriesData1,
            labelLine: {
              show: false,
            },
          },
          {
            type: 'pie',
            radius: ['35%', '45%'],
            center: ['25%', '50%'],
            hoverAnimation: false,
            label: {
              show: false,
            },
            data: seriesData2,
            labelLine: {
              show: false,
            },
          },
          {
            type: 'pie',
            radius: ['29%', '35%'],
            center: ['25%', '50%'],
            hoverAnimation: false,
            label: {
              show: false,
            },
            data: seriesData3,
            labelLine: {
              show: false,
            },
          },
        ],
      };
      this.$nextTick(() => {
        this.$refs.chart.initChart(echarts, chart => {
          // chart.setOption(this.options)
          this.options && chart.setOption(this.options, true);
        });
      })
    }
  }
}
</script>
ChartPanel.vue 对echarts组件的二次封装
<template>
  <div ref="chartPanel" class="chart-panel" :class="className" :style="{ height: height, width: width }" />
</template>

<script>
// echarts v4 import
// import echarts from 'echarts'
// echarts v5 import
import * as echarts from 'echarts'
require('echarts/theme/macarons') // echarts theme
import { debounce } from '@/utils'

export default {
  name: 'ChartPanel',
  props: {
    className: {
      type: String,
      default: 'chart'
    },
    width: {
      type: String,
      default: '100%'
    },
    height: {
      type: String,
      default: '100%'
    },
    mini: {
      type: Boolean,
      default: false
    },
    autoResize: {
      type: Boolean,
      default: true
    },
    option: {
      type: Object,
      required: true
    },
    initName: {
      type: String,
      default() { return '' }
    },
    initMap: {
      type: Object,
      default: null
    }
  },
  data() {
    return {
      chart: null,
      timer: null
    }
  },
  watch: {
    option: {
      deep: true,
      handler(val) {
        if (this.initName && this.initMap) {
          // echarts更新到5.x之后就不能重新设置option了 必须重新init图形
          this.initChart()
        } else {
          if (this.chart) {
            this.chart.clear()
            const that = this
            that.timer = setTimeout(() => {
              that.chart.setOption(val, true)
            }, 500)
          }
        }
      }
    },
    initName: {
      deep: true,
      handler(val) {
        this.initChart()
        this.resize()
      }
    }
  },
  mounted() {
    this.$nextTick(() => {
      this.initChart()
    })
    if (this.autoResize) {
      this.__resizeHandler = debounce(() => {
        if (this.chart) {
          this.chart.resize()
        }
      }, 100)
      window.addEventListener('resize', this.__resizeHandler)
    }

    // 监听侧边栏的变化
    this.sidebarElm = document.getElementsByClassName('sidebar-container')[0]
    this.sidebarElm && this.sidebarElm.addEventListener('transitionend', this.sidebarResizeHandler)
  },
  beforeDestroy() {
    if (!this.chart) {
      return
    }
    if (this.autoResize) {
      window.removeEventListener('resize', this.__resizeHandler)
    }

    this.sidebarElm && this.sidebarElm.removeEventListener('transitionend', this.sidebarResizeHandler)
    this.chart.dispose()
    this.chart = null
    clearTimeout(this.timer)
  },
  methods: {
    sidebarResizeHandler(e) {
      if (e.propertyName === 'width') {
        this.__resizeHandler()
      }
    },
    initChart() {
      this.chart = echarts.init(this.$el)
      // this.chart = echarts.init(this.$el, 'macarons')
      if (this.initName && this.initMap) {
        echarts.registerMap(this.initName, this.initMap)
      }
      if (this.option != null) {
        this.chart.clear()
        const that = this
        this.timer = setTimeout(() => {
          that.chart.setOption(that.option, true)
        }, 500)
      }
      this.$emit('initChart', this.chart)
    },
    resize() {
      if (this.chart != null) {
        this.chart.resize()
      }
    }
  }
}
</script>
debounce方法:
/**
 * @param {Function} func
 * @param {number} wait
 * @param {boolean} immediate
 * @return {*}
 */
export function debounce(func, wait, immediate) {
  let timeout, args, context, timestamp, result;

  const later = function() {
    // 据上一次触发时间间隔
    const last = +new Date() - timestamp;

    // 上次被包装函数被调用时间间隔 last 小于设定时间间隔 wait
    if (last < wait && last > 0) {
      timeout = setTimeout(later, wait - last);
    } else {
      timeout = null;
      // 如果设定为immediate===true,因为开始边界已经调用过了此处无需调用
      if (!immediate) {
        result = func.apply(context, args);
        if (!timeout) context = args = null;
      }
    }
  };

  return function(...args) {
    context = this;
    timestamp = +new Date();
    const callNow = immediate && !timeout;
    // 如果延时不存在,重新设定延时
    if (!timeout) timeout = setTimeout(later, wait);
    if (callNow) {
      result = func.apply(context, args);
      context = args = null;
    }

    return result;
  };
}
文章来源:https://blog.csdn.net/Koreyoshi123654/article/details/135058399
本文来自互联网用户投稿,该文观点仅代表作者本人,不代表本站立场。本站仅提供信息存储空间服务,不拥有所有权,不承担相关法律责任。 如若内容造成侵权/违法违规/事实不符,请联系我的编程经验分享网邮箱:veading@qq.com进行投诉反馈,一经查实,立即删除!
本文来自互联网用户投稿,该文观点仅代表作者本人,不代表本站立场。本站仅提供信息存储空间服务,不拥有所有权,不承担相关法律责任。 如若内容造成侵权/违法违规/事实不符,请联系我的编程经验分享网邮箱:veading@qq.com进行投诉反馈,一经查实,立即删除!