Prometheus实战篇:Prometheus监控nginx
2024-01-08 06:28:40
准备环境
在此专栏的前几篇文章中已经准备了一台服务器作为我们进行环境的准备.大家也可以通过虚拟机创建俩台服务器,一台作为Prometheus的安装另外一台进行其他软件安装并且进行监控的服务器.
这里我就不赘述nginx的安装教程,相信大家都可以搜到,使用docker或者直接通过安装包解压的方式都可以,我这里是通过docker的方式进行安装的,后面的操作其实都是大差不差的.
nginx开启stub_status
- 监控nginx需要with-http_stub_status_module这个模块
首先检查是否有安装with-http_stub_status_module模块
docker方式安装
docker exec -it nginx nginx -v 2>&1 |grep -o with-http_stub_status_module
nginx安装包方式安装
nginx nginx -v 2>&1 |grep -o with-http_stub_status_module
nginx开启stub_status配置
将下面配置文件写到nginx.conf配置文件中:
server {
	.....
	location /stub_status {
		stub_status on;
		access_log off;
		allow 0.0.0.0/0;
		deny all;
	}
	....
}
重新加载配置文件
docker exec -it nginx nginx -s reload
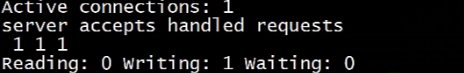
检查是否开启成功
curl http://localhost/syub_status
成功如下图:
安装Exporter
在上篇文章中说了Prometheus需要监控什么软件需要对应安装的Exporter,当然这里可以使用二进制安装也可以使用docker安装.这里为了方便,还是选择docker-compose的方式直接安装
docker-compose方式进行安装
这里直接通过创建docker-compose.yaml然后进行追加配置
cat >docker-compose.yaml <<FOF
version: '3.3'
services:
 nginx_exproter:
 	image:nginx/nginx-prometheus-exporter:0.11
 	container_name: nginx_exporter
 	hostname: nginx_exporter
 	command:
 	 - '-nginx.scrape-uri=http://localhost/stub_status'
 	 restart: always
 	 port:
 	 - "9113:9113"
EOF
启动
docker-compose up -d
检查
查看正在运行的容器
docker ps

或者:

查看nginx_exporter容器的运行日志
docker logs -f nginx_exporter
metrics地址
安装好Exporter后会暴露一个/metrics结尾的服务
| 名称 | 地址 |
|---|---|
| nginx_exporter | http://localhost:9113/metrics |
Prometheus配置
配置Prometheus去采集(拉取)nginx_exporter的监控样本数据
cd /data/docker-prometheus

# 在scrapc_configs(搜刮配置):下面增加如下配置:
cat >prometheus/prometheus.yml <<FOF
 - job_name: 'nginx_exporter'
   static_configs:
   - targets: ['localhost:9113']
   	 labels:
   	 	instance: test服务器
EOF
重新加载配置
curl -x POST http://localhost:9090/-/reload
检查
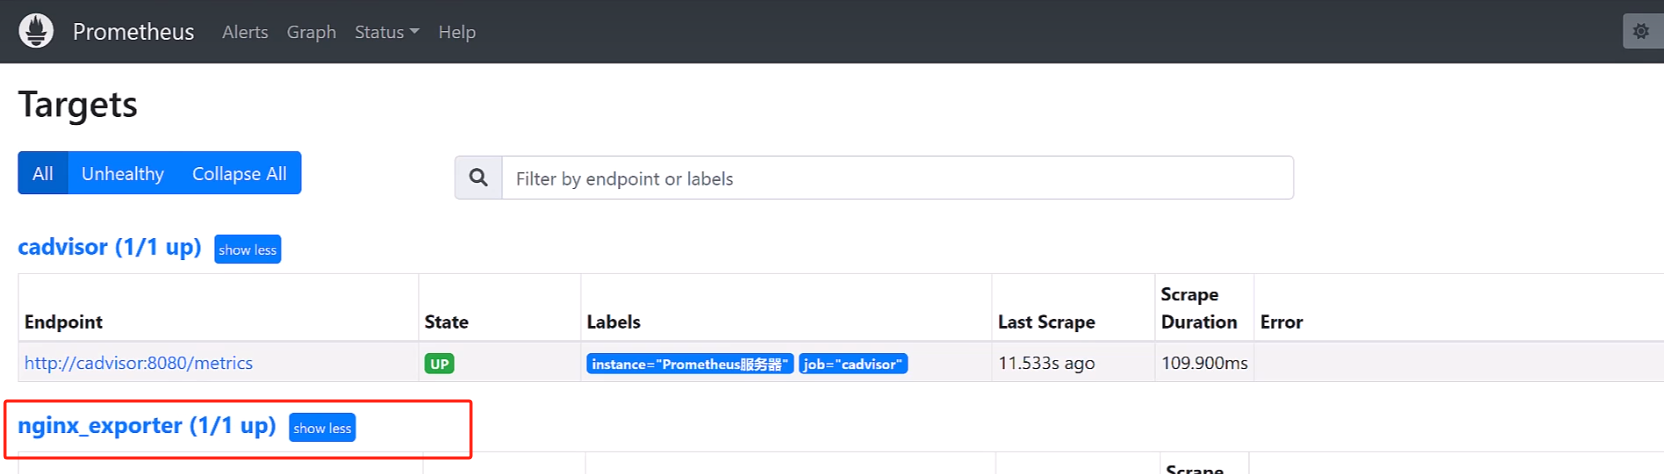
常用的nginx监控指标
nginx_connections_accepted	接受请求数
nginx_connections_active	活动连接数
nginx_connections_handled	成功处理请求数
nginx_connections_reding	正在进行读操作的请求数
nginx_connections_waiting	正在等待的请求数
nginx_connections_writing	正在进行写操作的请求数
nginx_connections_requests	总请求数
添加触发器
cd /data/docker-prometheus
cat >prometheus/alert.yml <<FOF
 -name: nginx
  rules:
  # 任何势力超过30秒无法联系的情况发出警报
  - alert: NginxDown
  	expr: nginx_up ==0
  	for: 30s
  	labels:
  	  severity: critical
  	annotations:
  		summary:"nginx异常,实例:{{$labels.instance }}"
  		description: "{{$lables.job}} nginx已关闭"
EOF
检查:
vim prometheus/alert.yml
检查配置
docker exec -it prometheus promtool check config /etc/prometheus/prometheus.yml
重新加载配置
curl -x POST http://localhost:9090/-/reload
检查
http://localhost:9090/alerts?search=
或:
dashboard
grafana展示Prometheus从nginx_exporter收集到的数据
文章来源:https://blog.csdn.net/weixin_45442617/article/details/135404524
本文来自互联网用户投稿,该文观点仅代表作者本人,不代表本站立场。本站仅提供信息存储空间服务,不拥有所有权,不承担相关法律责任。 如若内容造成侵权/违法违规/事实不符,请联系我的编程经验分享网邮箱:veading@qq.com进行投诉反馈,一经查实,立即删除!
本文来自互联网用户投稿,该文观点仅代表作者本人,不代表本站立场。本站仅提供信息存储空间服务,不拥有所有权,不承担相关法律责任。 如若内容造成侵权/违法违规/事实不符,请联系我的编程经验分享网邮箱:veading@qq.com进行投诉反馈,一经查实,立即删除!