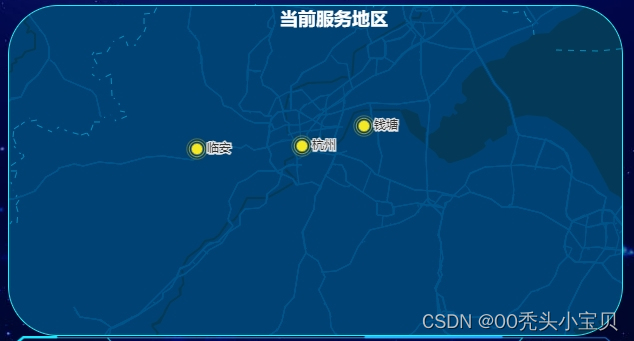
实现区域地图散点图效果,vue+echart地图+散点图
2023-12-29 18:54:01
1.效果图

2.准备工作,在main.js和index.js文件中添加以下内容
main.js
app.use(BaiduMap, {
    // ak 是在百度地图开发者平台申请的密钥 详见 http://lbsyun.baidu.com/apiconsole/key */
    ak: 'sRDDfAKpCSG5iF1rvwph4Q95M6tDCApL',
    // v:'3.0',  // 默认使用3.0
    // type: 'WebGL' // ||API 默认API  (使用此模式 BMap=BMapGL)
});

index.js
 <script type="text/javascript" src="https://api.map.baidu.com/getscript?v=3.0&ak=sRDDfAKpCSG5iF1rvwph4Q95M6tDCApL"></script>
3.html
<template>
  <div>
      <div id="main6"
         style="width:650px;height:400px;"></div>
  </div>
</template>
4.script
<script setup>
import * as echarts from 'echarts';
import 'echarts/extension/bmap/bmap';
import {onMounted} from 'vue';
       const initMap = () =>{
            var chartDom = document.getElementById('main6');
            var myChart = echarts.init(chartDom);
            var option;
            //如果数据请求,变更下面数据
            var data = [
                { name: '杭州', value: 177 },
                { name: '临安', value: 193 },
                { name: '钱塘', value: 194 }
            ];
            var geoCoordMap = {
                    杭州: [120.21551 , 30.25308 ],
                    临安: [119.73152 , 30.23981],
                    钱塘: [120.50048 , 30.32932]
            };
            var convertData = function (data) {
                var res = [];
                for (var i = 0; i < data.length; i++) {
                    var geoCoord = geoCoordMap[data[i].name];
                    if (geoCoord) {
                    res.push({
                        name: data[i].name,
                        value: geoCoord.concat(data[i].value)
                    });
                    }
                }
                return res;
            };
            option = {
            backgroundColor: 'rgba(0,0,0,.1)',
            title: {
                text: '当前服务地区',
                left: 'center',
                textStyle: {
                color: '#fff'
                }
            },
            tooltip: {
                trigger: 'item'
            },
            bmap: { //地理坐标系组件用于地图的绘制,支持在地图地理坐标系上绘制散点图,线集
                center: [120.22221, 30.2084],
                zoom: 10,
                roam: true, //是否允许鼠标放大缩小
                mapStyle: { //地图显示的样式
                styleJson: [
                    {
                    featureType: 'water',
                    elementType: 'all',
                    stylers: {
                        color: '#044161'
                    }
                    },
                    {
                    featureType: 'land',
                    elementType: 'all',
                    stylers: {
                        color: '#004981'
                    }
                    },
                    {
                    featureType: 'boundary',
                    elementType: 'geometry',
                    stylers: {
                        color: '#064f85'
                    }
                    },
                    {
                    featureType: 'railway',
                    elementType: 'all',
                    stylers: {
                        visibility: 'off'
                    }
                    },
                    {
                    featureType: 'highway',
                    elementType: 'geometry',
                    stylers: {
                        color: '#004981'
                    }
                    },
                    {
                    featureType: 'highway',
                    elementType: 'geometry.fill',
                    stylers: {
                        color: '#005b96',
                        lightness: 1
                    }
                    },
                    {
                    featureType: 'highway',
                    elementType: 'labels',
                    stylers: {
                        visibility: 'off'
                    }
                    },
                    {
                    featureType: 'arterial',
                    elementType: 'geometry',
                    stylers: {
                        color: '#004981'
                    }
                    },
                    {
                    featureType: 'arterial',
                    elementType: 'geometry.fill',
                    stylers: {
                        color: '#00508b'
                    }
                    },
                    {
                    featureType: 'poi',
                    elementType: 'all',
                    stylers: {
                        visibility: 'off'
                    }
                    },
                    {
                    featureType: 'green',
                    elementType: 'all',
                    stylers: {
                        color: '#056197',
                        visibility: 'off'
                    }
                    },
                    {
                    featureType: 'subway',
                    elementType: 'all',
                    stylers: {
                        visibility: 'off'
                    }
                    },
                    {
                    featureType: 'manmade',
                    elementType: 'all',
                    stylers: {
                        visibility: 'off'
                    }
                    },
                    {
                    featureType: 'local',
                    elementType: 'all',
                    stylers: {
                        visibility: 'off'
                    }
                    },
                    {
                    featureType: 'arterial',
                    elementType: 'labels',
                    stylers: {
                        visibility: 'off'
                    }
                    },
                    {
                    featureType: 'boundary',
                    elementType: 'geometry.fill',
                    stylers: {
                        color: '#029fd4'
                    }
                    },
                    {
                    featureType: 'building',
                    elementType: 'all',
                    stylers: {
                        color: '#1a5787'
                    }
                    },
                    {
                    featureType: 'label',
                    elementType: 'all',
                    stylers: {
                        visibility: 'off'
                    }
                    }
                ]
                }
            },
            series: [
                {
                name: '',
                type: 'effectScatter', //样式
                coordinateSystem: 'bmap', //该系列使用的坐标系
                data: convertData(
                    data
                    .sort(function (a, b) {
                        return b.value - a.value;
                    })
                    .slice(0, 6)
                ),
                encode: {
                    value: 2
                },
                showEffectOn: 'render',
                rippleEffect: { //涟漪特效相关配置。
                    brushType: 'stroke' //波纹的绘制方式
                },
                symbolSize: 10,  //标记的大小,可以设置数组或函数返回值的形式
                hoverAnimation: true, // 鼠标移入放大圆
                label: {
                    formatter: '{b}',
                    position: 'right',
                    show: true
                },
                itemStyle: {    //样式
                    color: '#f4e925',
                    shadowBlur: 10,
                    shadowColor: '#333'
                },
                emphasis: { //高亮状态下的多边形和标签样式
                    scale: true
                },
                zlevel: 1
                }
            ]
            };

            option && myChart.setOption(option);

        }

        onMounted(() => {
            initMap()
        })
</script>
文章来源:https://blog.csdn.net/m0_72929120/article/details/135296030
本文来自互联网用户投稿,该文观点仅代表作者本人,不代表本站立场。本站仅提供信息存储空间服务,不拥有所有权,不承担相关法律责任。 如若内容造成侵权/违法违规/事实不符,请联系我的编程经验分享网邮箱:veading@qq.com进行投诉反馈,一经查实,立即删除!
本文来自互联网用户投稿,该文观点仅代表作者本人,不代表本站立场。本站仅提供信息存储空间服务,不拥有所有权,不承担相关法律责任。 如若内容造成侵权/违法违规/事实不符,请联系我的编程经验分享网邮箱:veading@qq.com进行投诉反馈,一经查实,立即删除!