案例系列:营销模型_客户细分_无监督聚类
案例系列:营销模型_客户细分_无监督聚类
import numpy as np # 线性代数库
import pandas as pd # 数据处理库,CSV文件的输入输出(例如pd.read_csv)
/kaggle/input/customer-personality-analysis/marketing_campaign.csv
在这个项目中,我将对来自一家杂货公司数据库的客户记录进行无监督聚类分析。客户细分是将客户分成反映每个群集中客户相似性的群组的实践。我将把客户分成不同的细分,以优化每个客户对业务的重要性。根据客户的不同需求和行为来调整产品。它还帮助企业满足不同类型客户的关注点。
导入库
# 导入库
import numpy as np
import pandas as pd
import datetime
import matplotlib
import matplotlib.pyplot as plt
from matplotlib import colors
import seaborn as sns
from sklearn.preprocessing import LabelEncoder
from sklearn.preprocessing import StandardScaler
from sklearn.decomposition import PCA
from yellowbrick.cluster import KElbowVisualizer
from sklearn.cluster import KMeans
import matplotlib.pyplot as plt, numpy as np
from mpl_toolkits.mplot3d import Axes3D
from sklearn.cluster import AgglomerativeClustering
from matplotlib.colors import ListedColormap
from sklearn import metrics
import warnings
import sys

# 忽略警告
if not sys.warnoptions:
    warnings.simplefilter("ignore")

# 设置随机种子
np.random.seed(42)
加载数据中
# 加载数据集
data = pd.read_csv("../input/customer-personality-analysis/marketing_campaign.csv", sep="\t")

# 打印数据点的数量
print("Number of datapoints:", len(data))

# 打印数据集的前几行数据
data.head()
Number of datapoints: 2240
| ID | Year_Birth | Education | Marital_Status | Income | Kidhome | Teenhome | Dt_Customer | Recency | MntWines | ... | NumWebVisitsMonth | AcceptedCmp3 | AcceptedCmp4 | AcceptedCmp5 | AcceptedCmp1 | AcceptedCmp2 | Complain | Z_CostContact | Z_Revenue | Response | |
|---|---|---|---|---|---|---|---|---|---|---|---|---|---|---|---|---|---|---|---|---|---|
| 0 | 5524 | 1957 | Graduation | Single | 58138.0 | 0 | 0 | 04-09-2012 | 58 | 635 | ... | 7 | 0 | 0 | 0 | 0 | 0 | 0 | 3 | 11 | 1 |
| 1 | 2174 | 1954 | Graduation | Single | 46344.0 | 1 | 1 | 08-03-2014 | 38 | 11 | ... | 5 | 0 | 0 | 0 | 0 | 0 | 0 | 3 | 11 | 0 |
| 2 | 4141 | 1965 | Graduation | Together | 71613.0 | 0 | 0 | 21-08-2013 | 26 | 426 | ... | 4 | 0 | 0 | 0 | 0 | 0 | 0 | 3 | 11 | 0 |
| 3 | 6182 | 1984 | Graduation | Together | 26646.0 | 1 | 0 | 10-02-2014 | 26 | 11 | ... | 6 | 0 | 0 | 0 | 0 | 0 | 0 | 3 | 11 | 0 |
| 4 | 5324 | 1981 | PhD | Married | 58293.0 | 1 | 0 | 19-01-2014 | 94 | 173 | ... | 5 | 0 | 0 | 0 | 0 | 0 | 0 | 3 | 11 | 0 |
5 rows × 29 columns
数据情况
客户个性分析是对公司理想客户的详细分析。它帮助企业更好地了解其客户,并使其更容易根据不同类型客户的特定需求、行为和关注点来修改产品。
客户个性分析帮助企业根据不同类型客户群体中的目标客户来修改其产品。例如,公司可以分析哪个客户群体最有可能购买该产品,而不是花钱将新产品推销给公司数据库中的每个客户,然后只在该特定客户群体中推销该产品。
变量解释
人物
ID:客户的唯一标识符
Year_Birth:客户的出生年份
Education:客户的教育水平
Marital_Status:客户的婚姻状况
Income:客户的年收入
Kidhome:客户家庭中的儿童数量
Teenhome:客户家庭中的青少年数量
Dt_Customer:客户加入公司的日期
Recency:客户上次购买以来的天数
Complain:如果客户在过去2年中投诉,则为1,否则为0
产品
MntWines:过去2年中花费在葡萄酒上的金额
MntFruits:过去2年中花费在水果上的金额
MntMeatProducts:过去2年中花费在肉类上的金额
MntFishProducts:过去2年中花费在鱼类上的金额
MntSweetProducts:过去2年中花费在糖果上的金额
MntGoldProds:过去2年中花费在黄金上的金额
促销
NumDealsPurchases:使用折扣购买的次数
AcceptedCmp1:如果客户接受了第1次活动的优惠,则为1,否则为0
AcceptedCmp2:如果客户接受了第2次活动的优惠,则为1,否则为0
AcceptedCmp3:如果客户接受了第3次活动的优惠,则为1,否则为0
AcceptedCmp4:如果客户接受了第4次活动的优惠,则为1,否则为0
AcceptedCmp5:如果客户接受了第5次活动的优惠,则为1,否则为0
Response:如果客户接受了最后一次活动的优惠,则为1,否则为0
地点
NumWebPurchases:通过公司网站购买的次数
NumCatalogPurchases:使用目录购买的次数
NumStorePurchases:直接在商店购买的次数
NumWebVisitsMonth:上个月访问公司网站的次数属性
数据清洗
在本节中
- 数据清洗
- 特征工程
为了全面了解应该采取哪些步骤来清洗数据集。
让我们来看看数据中的信息。
# 打印数据集的信息
data.info()
<class 'pandas.core.frame.DataFrame'>
RangeIndex: 2240 entries, 0 to 2239
Data columns (total 29 columns):
 #   Column               Non-Null Count  Dtype
---  ------               --------------  -----
 0   ID                   2240 non-null   int64
 1   Year_Birth           2240 non-null   int64
 2   Education            2240 non-null   object
 3   Marital_Status       2240 non-null   object
 4   Income               2216 non-null   float64
 5   Kidhome              2240 non-null   int64
 6   Teenhome             2240 non-null   int64
 7   Dt_Customer          2240 non-null   object
 8   Recency              2240 non-null   int64
 9   MntWines             2240 non-null   int64
 10  MntFruits            2240 non-null   int64
 11  MntMeatProducts      2240 non-null   int64
 12  MntFishProducts      2240 non-null   int64
 13  MntSweetProducts     2240 non-null   int64
 14  MntGoldProds         2240 non-null   int64
 15  NumDealsPurchases    2240 non-null   int64
 16  NumWebPurchases      2240 non-null   int64
 17  NumCatalogPurchases  2240 non-null   int64
 18  NumStorePurchases    2240 non-null   int64
 19  NumWebVisitsMonth    2240 non-null   int64
 20  AcceptedCmp3         2240 non-null   int64
 21  AcceptedCmp4         2240 non-null   int64
 22  AcceptedCmp5         2240 non-null   int64
 23  AcceptedCmp1         2240 non-null   int64
 24  AcceptedCmp2         2240 non-null   int64
 25  Complain             2240 non-null   int64
 26  Z_CostContact        2240 non-null   int64
 27  Z_Revenue            2240 non-null   int64
 28  Response             2240 non-null   int64
dtypes: float64(1), int64(25), object(3)
memory usage: 507.6+ KB
从上面的输出中,我们可以得出以下结论和注意事项:
- 收入中存在缺失值
- Dt_Customer表示客户加入数据库的日期没有被解析为DateTime类型
- 我们的数据框中有一些分类特征;因为有一些特征的数据类型是object类型。所以我们需要将它们转换为数值形式。
首先,对于缺失值,我打算简单地删除具有缺失收入值的行。
# 删除缺失值
data = data.dropna()
# 打印删除缺失值后的数据点总数
print("删除缺失值后的数据点总数为:", len(data))
The total number of data-points after removing the rows with missing values are: 2216
在下一步中,我将创建一个特征,即**“Dt_Customer”**,该特征表示客户在公司数据库中注册的天数。然而,为了简单起见,我将以相对于记录中最近的客户的值为基准。
因此,为了获得这些值,我必须检查最新和最旧的记录日期。
# 将"data"中的"Dt_Customer"列转换为日期格式
data["Dt_Customer"] = pd.to_datetime(data["Dt_Customer"])

# 创建一个空列表"dates"用于存储日期
dates = []

# 遍历"data"中的"Dt_Customer"列中的每个日期
for i in data["Dt_Customer"]:
    # 将日期转换为日期格式,只保留日期部分
    i = i.date()
    # 将日期添加到"dates"列表中
    dates.append(i)

# 打印最新和最旧记录的客户的日期
print("最新记录的客户的注册日期:", max(dates))
print("最旧记录的客户的注册日期:", min(dates))
The newest customer's enrolment date in therecords: 2014-12-06
The oldest customer's enrolment date in the records: 2012-01-08
创建一个特征**(“Customer_For”)**,表示顾客开始在商店购物的天数与最后记录日期相对应。
# 创建了一个名为"Customer_For"的特征

days = []  # 创建一个空列表用于存储日期差值
d1 = max(dates)  # 将最大日期设为最新的客户日期

# 遍历日期列表
for i in dates:
    delta = d1 - i  # 计算最新客户日期与当前日期的差值
    days.append(delta)  # 将差值添加到days列表中

data["Customer_For"] = days  # 将days列表赋值给名为"Customer_For"的特征列

data["Customer_For"] = pd.to_numeric(data["Customer_For"], errors="coerce")  # 将"Customer_For"特征列转换为数字类型,如果出现错误则设置为NaN
现在我们将探索分类特征中的唯一值,以便更清楚地了解数据。
# 打印出特征"Marital_Status"中的所有类别及其数量
print("特征Marital_Status中的所有类别及其数量:\n", data["Marital_Status"].value_counts(), "\n")

# 打印出特征"Education"中的所有类别及其数量
print("特征Education中的所有类别及其数量:\n", data["Education"].value_counts())
Total categories in the feature Marital_Status:
 Married     857
Together    573
Single      471
Divorced    232
Widow        76
Alone         3
Absurd        2
YOLO          2
Name: Marital_Status, dtype: int64

Total categories in the feature Education:
 Graduation    1116
PhD            481
Master         365
2n Cycle       200
Basic           54
Name: Education, dtype: int64
在接下来的部分中,我将执行以下步骤来构建一些新的特征:
- 通过**“Year_Birth"提取客户的"Age”**,表示相应人员的出生年份。
- 创建另一个特征**“Spent”**,表示客户在两年内在各个类别上的总消费金额。
- 从**“Marital_Status"中创建另一个特征"Living_With”**,以提取夫妻的居住情况。
- 创建一个特征**“Children”**,表示一个家庭中的孩子和青少年的总数。
- 为了更清楚地了解家庭情况,创建一个表示**“Family_Size”**的特征。
- 创建一个特征**“Is_Parent”**,表示是否为父母。
- 最后,我将通过简化其值计数来创建**“Education”**中的三个类别。
- 删除一些冗余特征。
# 特征工程

# 计算顾客的年龄
data["Age"] = 2021 - data["Year_Birth"]

# 计算顾客在各种商品上的总消费金额
data["Spent"] = data["MntWines"] + data["MntFruits"] + data["MntMeatProducts"] + data["MntFishProducts"] + data["MntSweetProducts"] + data["MntGoldProds"]

# 根据婚姻状况推断居住情况,将"Married"和"Together"替换为"Partner",将"Absurd"、"Widow"、"YOLO"、"Divorced"和"Single"替换为"Alone"
data["Living_With"] = data["Marital_Status"].replace({"Married": "Partner", "Together": "Partner", "Absurd": "Alone", "Widow": "Alone", "YOLO": "Alone", "Divorced": "Alone", "Single": "Alone"})

# 计算家庭中的孩子数量
data["Children"] = data["Kidhome"] + data["Teenhome"]

# 计算家庭成员总数
data["Family_Size"] = data["Living_With"].replace({"Alone": 1, "Partner": 2}) + data["Children"]

# 根据是否有孩子来判断是否为父母
data["Is_Parent"] = np.where(data.Children > 0, 1, 0)

# 将教育水平分为三个组别
data["Education"] = data["Education"].replace({"Basic": "Undergraduate", "2n Cycle": "Undergraduate", "Graduation": "Graduate", "Master": "Postgraduate", "PhD": "Postgraduate"})

# 为了清晰起见,重命名一些特征列
data = data.rename(columns={"MntWines": "Wines", "MntFruits": "Fruits", "MntMeatProducts": "Meat", "MntFishProducts": "Fish", "MntSweetProducts": "Sweets", "MntGoldProds": "Gold"})

# 删除一些冗余的特征列
to_drop = ["Marital_Status", "Dt_Customer", "Z_CostContact", "Z_Revenue", "Year_Birth", "ID"]
data = data.drop(to_drop, axis=1)
现在我们有了一些新功能,让我们来看一下数据的统计信息。
# 对数据进行描述性统计分析
data.describe()
| Income | Kidhome | Teenhome | Recency | Wines | Fruits | Meat | Fish | Sweets | Gold | ... | AcceptedCmp1 | AcceptedCmp2 | Complain | Response | Customer_For | Age | Spent | Children | Family_Size | Is_Parent | |
|---|---|---|---|---|---|---|---|---|---|---|---|---|---|---|---|---|---|---|---|---|---|
| count | 2216.000000 | 2216.000000 | 2216.000000 | 2216.000000 | 2216.000000 | 2216.000000 | 2216.000000 | 2216.000000 | 2216.000000 | 2216.000000 | ... | 2216.000000 | 2216.000000 | 2216.000000 | 2216.000000 | 2.216000e+03 | 2216.000000 | 2216.000000 | 2216.000000 | 2216.000000 | 2216.000000 |
| mean | 52247.251354 | 0.441787 | 0.505415 | 49.012635 | 305.091606 | 26.356047 | 166.995939 | 37.637635 | 27.028881 | 43.965253 | ... | 0.064079 | 0.013538 | 0.009477 | 0.150271 | 4.423735e+16 | 52.179603 | 607.075361 | 0.947202 | 2.592509 | 0.714350 |
| std | 25173.076661 | 0.536896 | 0.544181 | 28.948352 | 337.327920 | 39.793917 | 224.283273 | 54.752082 | 41.072046 | 51.815414 | ... | 0.244950 | 0.115588 | 0.096907 | 0.357417 | 2.008532e+16 | 11.985554 | 602.900476 | 0.749062 | 0.905722 | 0.451825 |
| min | 1730.000000 | 0.000000 | 0.000000 | 0.000000 | 0.000000 | 0.000000 | 0.000000 | 0.000000 | 0.000000 | 0.000000 | ... | 0.000000 | 0.000000 | 0.000000 | 0.000000 | 0.000000e+00 | 25.000000 | 5.000000 | 0.000000 | 1.000000 | 0.000000 |
| 25% | 35303.000000 | 0.000000 | 0.000000 | 24.000000 | 24.000000 | 2.000000 | 16.000000 | 3.000000 | 1.000000 | 9.000000 | ... | 0.000000 | 0.000000 | 0.000000 | 0.000000 | 2.937600e+16 | 44.000000 | 69.000000 | 0.000000 | 2.000000 | 0.000000 |
| 50% | 51381.500000 | 0.000000 | 0.000000 | 49.000000 | 174.500000 | 8.000000 | 68.000000 | 12.000000 | 8.000000 | 24.500000 | ... | 0.000000 | 0.000000 | 0.000000 | 0.000000 | 4.432320e+16 | 51.000000 | 396.500000 | 1.000000 | 3.000000 | 1.000000 |
| 75% | 68522.000000 | 1.000000 | 1.000000 | 74.000000 | 505.000000 | 33.000000 | 232.250000 | 50.000000 | 33.000000 | 56.000000 | ... | 0.000000 | 0.000000 | 0.000000 | 0.000000 | 5.927040e+16 | 62.000000 | 1048.000000 | 1.000000 | 3.000000 | 1.000000 |
| max | 666666.000000 | 2.000000 | 2.000000 | 99.000000 | 1493.000000 | 199.000000 | 1725.000000 | 259.000000 | 262.000000 | 321.000000 | ... | 1.000000 | 1.000000 | 1.000000 | 1.000000 | 9.184320e+16 | 128.000000 | 2525.000000 | 3.000000 | 5.000000 | 1.000000 |
8 rows × 28 columns
上述统计数据显示了平均收入和年龄以及最高收入和年龄之间存在一些差异。
请注意,最大年龄为128岁,因为我计算的年龄是今天(即2021年),而数据是旧的。
我必须从更广泛的数据视角来看待这些数据。
我将绘制一些选定的特征。
# 设置颜色偏好
sns.set(rc={"axes.facecolor":"#FFF9ED","figure.facecolor":"#FFF9ED"})
pallet = ["#682F2F", "#9E726F", "#D6B2B1", "#B9C0C9", "#9F8A78", "#F3AB60"]
cmap = colors.ListedColormap(["#682F2F", "#9E726F", "#D6B2B1", "#B9C0C9", "#9F8A78", "#F3AB60"])

# 需要绘制的特征
To_Plot = [ "Income", "Recency", "Customer_For", "Age", "Spent", "Is_Parent"]

# 输出提示信息
print("Reletive Plot Of Some Selected Features: A Data Subset")

# 创建一个新的图形
plt.figure()

# 绘制特征之间的关系图
sns.pairplot(data[To_Plot], hue= "Is_Parent", palette= (["#682F2F","#F3AB60"]))

# 显示图形
plt.show()
Reletive Plot Of Some Selected Features: A Data Subset


<Figure size 576x396 with 0 Axes>
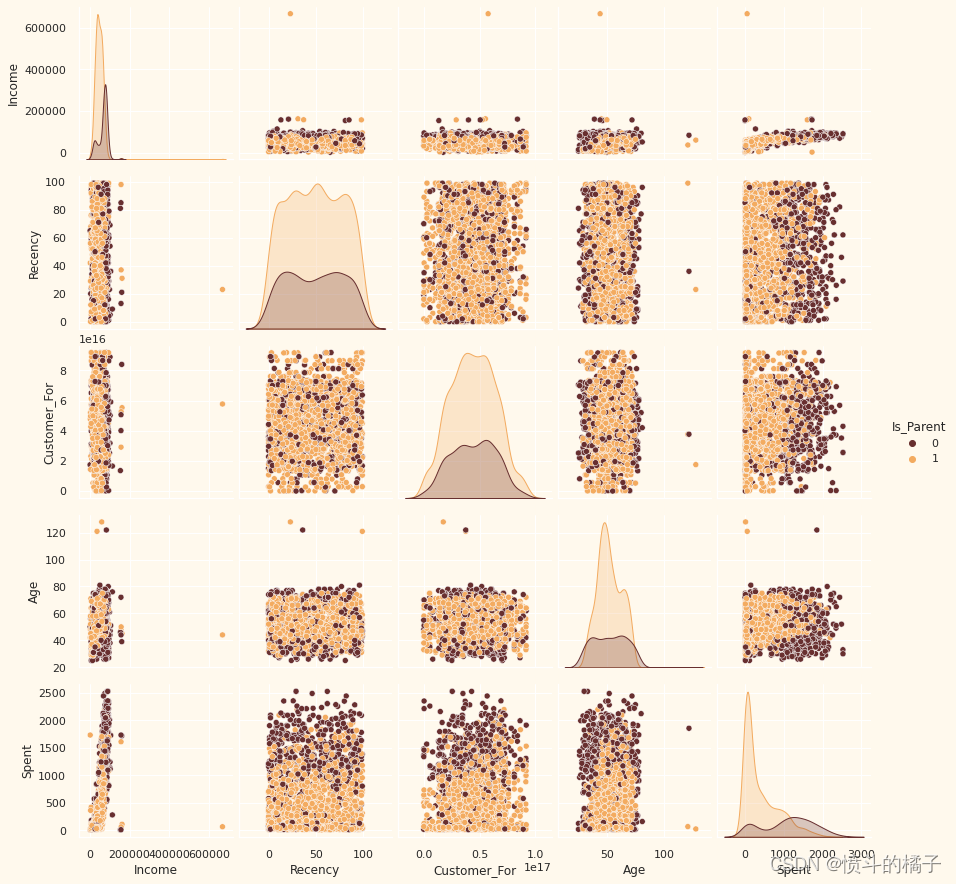
显然,收入和年龄特征中存在一些异常值。
我将删除数据中的异常值。
# 删除异常值,通过设置年龄和收入的上限来进行筛选
data = data[(data["Age"]<90)]  # 筛选出年龄小于90的数据
data = data[(data["Income"]<600000)]  # 筛选出收入小于600000的数据
print("删除异常值后的数据点总数为:", len(data))  # 打印删除异常值后的数据点总数
The total number of data-points after removing the outliers are: 2212
下面,让我们来看一下特征之间的相关性。
(在这一点上,不包括分类属性)
# 计算相关系数矩阵
corrmat = data.corr()

# 创建一个图像对象,设置图像大小为20x20
plt.figure(figsize=(20, 20))

# 使用热力图可视化相关系数矩阵
# annot=True 表示在热力图上显示数值
# cmap=cmap 表示使用指定的颜色映射
# center=0 表示将颜色映射的中心值设置为0
sns.heatmap(corrmat, annot=True, cmap=cmap, center=0)
<AxesSubplot:>
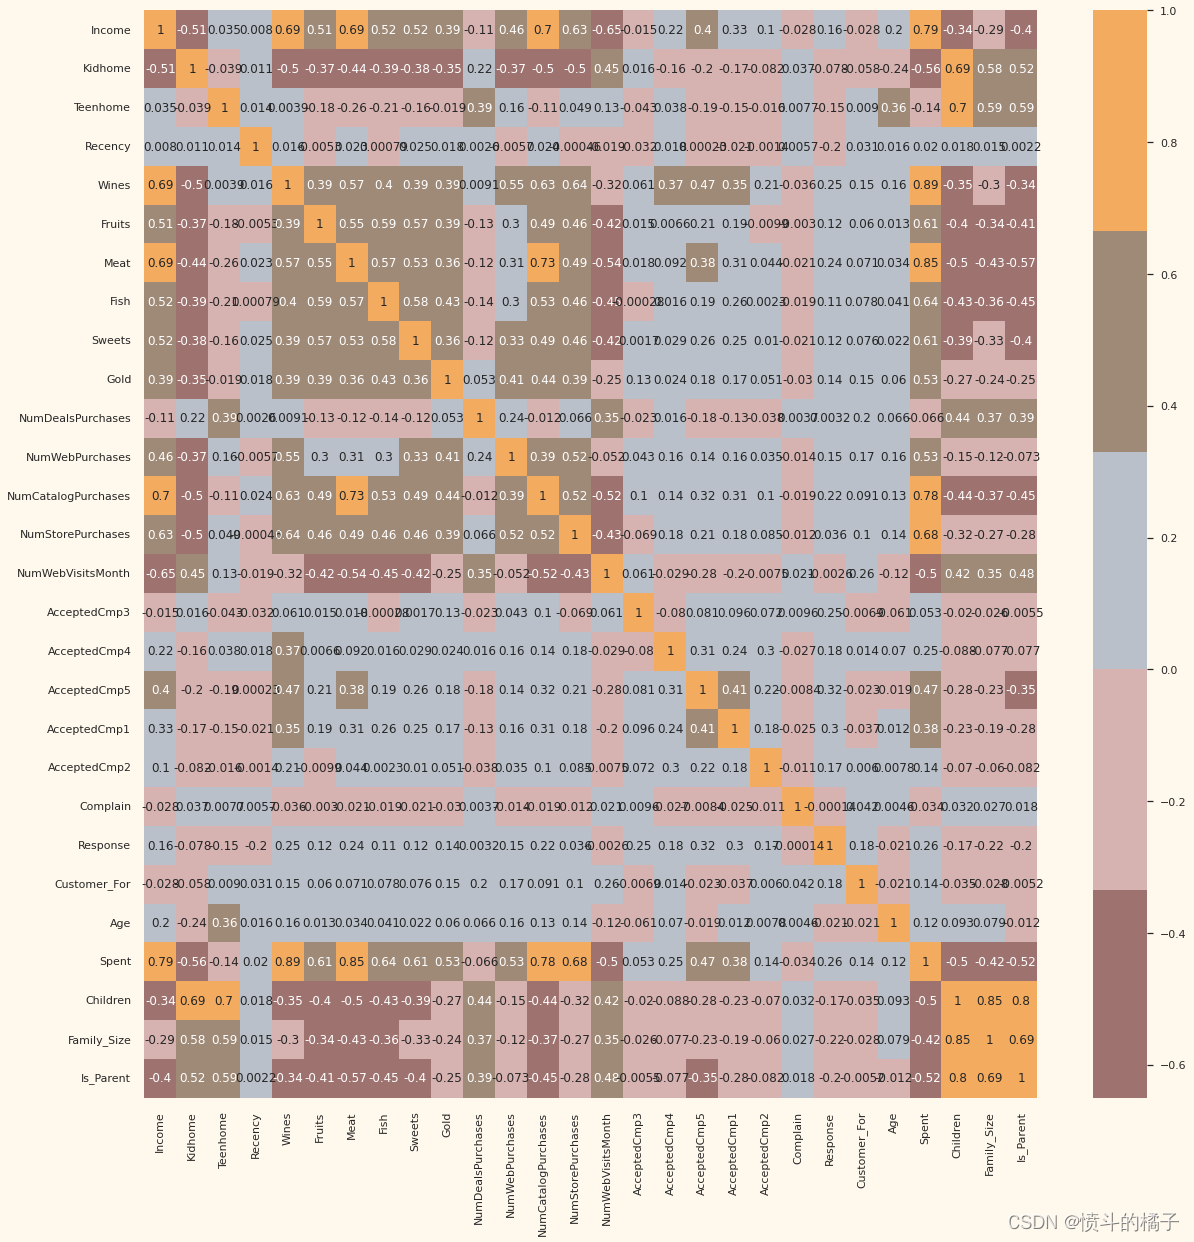
数据非常干净,新特征已经包含在内。我将继续下一步,即对数据进行预处理。
数据预处理
在本节中,我将对数据进行预处理以进行聚类操作。
以下步骤用于预处理数据:
- 对分类特征进行标签编码
- 使用标准缩放器对特征进行缩放
- 创建一个子数据框以进行降维处理
# 获取分类变量的列表
s = (data.dtypes == 'object')  # 将数据集中的数据类型为'object'的列标记为True,其他列标记为False
object_cols = list(s[s].index)  # 将标记为True的列的索引添加到object_cols列表中

print("Categorical variables in the dataset:", object_cols)  # 打印数据集中的分类变量列表
Categorical variables in the dataset: ['Education', 'Living_With']
# 创建一个LabelEncoder对象
LE = LabelEncoder()

# 对于每个object类型的列
for i in object_cols:
    # 使用LabelEncoder对象对该列进行编码,并将编码后的值赋给data[i]
    data[i] = data[[i]].apply(LE.fit_transform)

# 打印输出提示信息,表示所有特征现在都是数值类型的
print("所有特征现在都是数值类型的")
All features are now numerical
# 创建数据的副本
ds = data.copy()

# 创建一个数据子集,通过删除已接受的交易和促销特征
cols_del = ['AcceptedCmp3', 'AcceptedCmp4', 'AcceptedCmp5', 'AcceptedCmp1','AcceptedCmp2', 'Complain', 'Response']
ds = ds.drop(cols_del, axis=1)

# 缩放数据
scaler = StandardScaler()
scaler.fit(ds)
scaled_ds = pd.DataFrame(scaler.transform(ds),columns= ds.columns )

# 打印提示信息,表示所有特征已经被缩放
print("所有特征现在都已经被缩放")
All features are now scaled
# 打印提示信息,说明接下来要使用的是经过缩放的数据进行降维处理
print("用于进一步建模的数据框:")
# 打印经过缩放的数据的前几行,以便查看数据的结构和内容
scaled_ds.head()
Dataframe to be used for further modelling:
| Education | Income | Kidhome | Teenhome | Recency | Wines | Fruits | Meat | Fish | Sweets | ... | NumCatalogPurchases | NumStorePurchases | NumWebVisitsMonth | Customer_For | Age | Spent | Living_With | Children | Family_Size | Is_Parent | |
|---|---|---|---|---|---|---|---|---|---|---|---|---|---|---|---|---|---|---|---|---|---|
| 0 | -0.893586 | 0.287105 | -0.822754 | -0.929699 | 0.310353 | 0.977660 | 1.552041 | 1.690293 | 2.453472 | 1.483713 | ... | 2.503607 | -0.555814 | 0.692181 | 1.973583 | 1.018352 | 1.676245 | -1.349603 | -1.264598 | -1.758359 | -1.581139 |
| 1 | -0.893586 | -0.260882 | 1.040021 | 0.908097 | -0.380813 | -0.872618 | -0.637461 | -0.718230 | -0.651004 | -0.634019 | ... | -0.571340 | -1.171160 | -0.132545 | -1.665144 | 1.274785 | -0.963297 | -1.349603 | 1.404572 | 0.449070 | 0.632456 |
| 2 | -0.893586 | 0.913196 | -0.822754 | -0.929699 | -0.795514 | 0.357935 | 0.570540 | -0.178542 | 1.339513 | -0.147184 | ... | -0.229679 | 1.290224 | -0.544908 | -0.172664 | 0.334530 | 0.280110 | 0.740959 | -1.264598 | -0.654644 | -1.581139 |
| 3 | -0.893586 | -1.176114 | 1.040021 | -0.929699 | -0.795514 | -0.872618 | -0.561961 | -0.655787 | -0.504911 | -0.585335 | ... | -0.913000 | -0.555814 | 0.279818 | -1.923210 | -1.289547 | -0.920135 | 0.740959 | 0.069987 | 0.449070 | 0.632456 |
| 4 | 0.571657 | 0.294307 | 1.040021 | -0.929699 | 1.554453 | -0.392257 | 0.419540 | -0.218684 | 0.152508 | -0.001133 | ... | 0.111982 | 0.059532 | -0.132545 | -0.822130 | -1.033114 | -0.307562 | 0.740959 | 0.069987 | 0.449070 | 0.632456 |
5 rows × 23 columns
降维
在这个问题中,有许多因素是基于这些因素进行最终分类的基础。这些因素基本上是属性或特征。特征的数量越多,处理起来就越困难。其中许多特征是相关的,因此是冗余的。这就是为什么在将它们输入分类器之前,我将对所选特征进行降维处理的原因。
降维是通过获取一组主要变量来减少考虑的随机变量的数量的过程。
**主成分分析(PCA)**是一种用于降低此类数据集维度的技术,增加可解释性,同时最小化信息损失。
本节的步骤:
- 使用PCA进行降维
- 绘制降维后的数据框
使用PCA进行降维
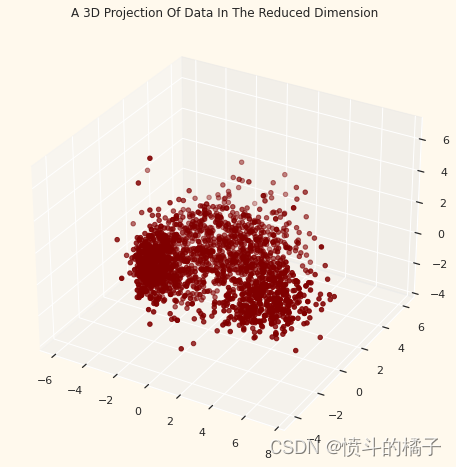
对于这个项目,我将把维度降低到3。
# 初始化PCA对象,将维度(特征)降低为3
pca = PCA(n_components=3)

# 使用PCA拟合标准化后的数据集
pca.fit(scaled_ds)

# 使用PCA将标准化后的数据集转换为降维后的数据集
PCA_ds = pd.DataFrame(pca.transform(scaled_ds), columns=(["col1","col2", "col3"]))

# 对降维后的数据集进行描述性统计分析,并进行转置
PCA_ds.describe().T
| count | mean | std | min | 25% | 50% | 75% | max | |
|---|---|---|---|---|---|---|---|---|
| col1 | 2212.0 | -1.116246e-16 | 2.878377 | -5.969394 | -2.538494 | -0.780421 | 2.383290 | 7.444305 |
| col2 | 2212.0 | 1.105204e-16 | 1.706839 | -4.312196 | -1.328316 | -0.158123 | 1.242289 | 6.142721 |
| col3 | 2212.0 | 3.049098e-17 | 1.221956 | -3.530416 | -0.829067 | -0.022692 | 0.799895 | 6.611222 |
# 获取数据
x = PCA_ds["col1"]
y = PCA_ds["col2"]
z = PCA_ds["col3"]

# 创建一个图形对象
fig = plt.figure(figsize=(10,8))

# 添加一个3D子图
ax = fig.add_subplot(111, projection="3d")

# 绘制散点图
ax.scatter(x, y, z, c="maroon", marker="o")

# 设置图标题
ax.set_title("A 3D Projection Of Data In The Reduced Dimension")

# 显示图形
plt.show()
聚类
现在我已经将属性减少到三个维度,我将通过凝聚聚类来进行聚类。凝聚聚类是一种层次聚类方法。它涉及合并示例,直到达到所需的聚类数。
聚类中涉及的步骤
- 肘部法确定要形成的聚类数
- 通过凝聚聚类进行聚类
- 通过散点图检查形成的聚类
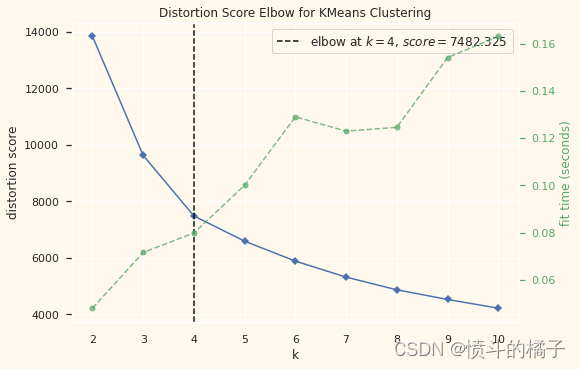
# 快速检查肘部法则以确定要形成的聚类数量。
print('使用肘部法则确定要形成的聚类数量:')

# 创建一个 KMeans 模型的肘部可视化器对象
Elbow_M = KElbowVisualizer(KMeans(), k=10)

# 使用 PCA_ds 数据拟合肘部可视化器对象
Elbow_M.fit(PCA_ds)

# 显示肘部可视化图
Elbow_M.show()
Elbow Method to determine the number of clusters to be formed:
<AxesSubplot:title={'center':'Distortion Score Elbow for KMeans Clustering'}, xlabel='k', ylabel='distortion score'>
上面的单元格表明对于这些数据来说,四个聚类是最优的。
接下来,我们将拟合凝聚聚类模型以获得最终的聚类。
# 导入AgglomerativeClustering模型
# 参数n_clusters=4表示将数据分为4个簇
AC = AgglomerativeClustering(n_clusters=4)

# 使用数据PCA_ds训练模型并预测簇
yhat_AC = AC.fit_predict(PCA_ds)

# 将预测的簇标签添加到PCA_ds数据集中的"Clusters"列
PCA_ds["Clusters"] = yhat_AC

# 将预测的簇标签添加到原始数据集data中的"Clusters"列
data["Clusters"] = yhat_AC
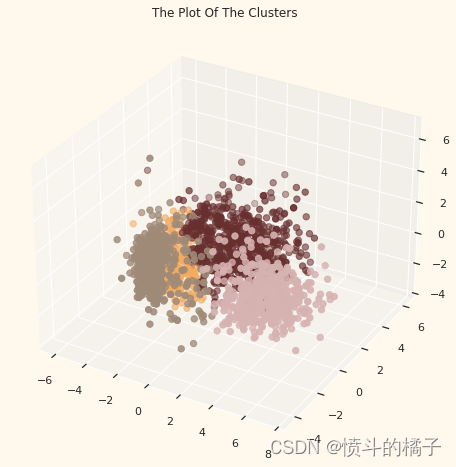
为了检查形成的聚类,让我们来看一下聚类的三维分布。
# 创建一个图形对象
fig = plt.figure(figsize=(10,8))

# 创建一个三维坐标轴对象
ax = plt.subplot(111, projection='3d', label="bla")

# 绘制散点图
# x, y, z 分别为数据点的 x, y, z 坐标
# s 为散点的大小
# c 为散点的颜色,根据 PCA_ds 数据集中的 "Clusters" 列的值来确定颜色
# marker 为散点的形状
# cmap 为颜色映射
ax.scatter(x, y, z, s=40, c=PCA_ds["Clusters"], marker='o', cmap = cmap )

# 设置图形标题
ax.set_title("The Plot Of The Clusters")

# 显示图形
plt.show()
评估模型
由于这是一个无监督的聚类,我们没有一个标记的特征来评估或打分我们的模型。本节的目的是研究形成的聚类中的模式,并确定聚类模式的性质。
为此,我们将通过探索性数据分析和得出结论来查看聚类的数据。
首先,让我们看一下聚类的群组分布
# 定义颜色列表
pal = ["#682F2F","#B9C0C9", "#9F8A78","#F3AB60"]

# 绘制计数图
pl = sns.countplot(x=data["Clusters"], palette= pal)

# 设置图表标题
pl.set_title("Distribution Of The Clusters")

# 显示图表
plt.show()
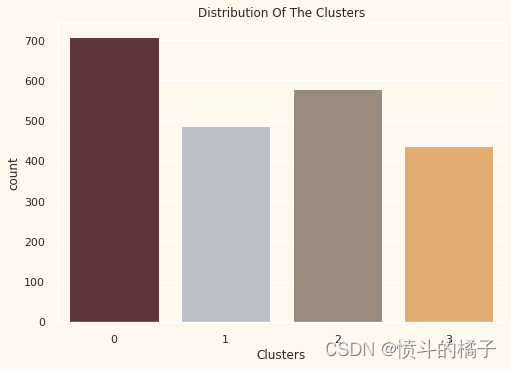
集群似乎分布相对均匀。
# 创建散点图
pl = sns.scatterplot(data=data, x=data["Spent"], y=data["Income"], hue=data["Clusters"], palette=pal)

# 设置图表标题
pl.set_title("Cluster's Profile Based On Income And Spending")

# 显示图例
plt.legend()

# 显示图表
plt.show()
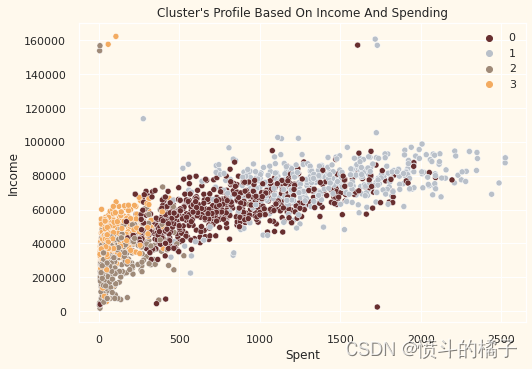
收入与支出图显示了集群模式
- 第0组:高支出和平均收入
- 第1组:高支出和高收入
- 第2组:低支出和低收入
- 第3组:高支出和低收入
接下来,我将根据数据中的各种产品来查看集群的详细分布。即:葡萄酒、水果、肉类、鱼类、糖果和黄金。
# 创建一个新的图形
plt.figure()

# 使用swarmplot函数绘制散点图,x轴为数据中的"Clusters"列,y轴为数据中的"Spent"列
# 设置散点的颜色为"#CBEDDD",透明度为0.5
pl = sns.swarmplot(x=data["Clusters"], y=data["Spent"], color="#CBEDDD", alpha=0.5)

# 使用boxenplot函数绘制箱线图,x轴为数据中的"Clusters"列,y轴为数据中的"Spent"列
# 设置调色板为pal
pl = sns.boxenplot(x=data["Clusters"], y=data["Spent"], palette=pal)

# 显示图形
plt.show()
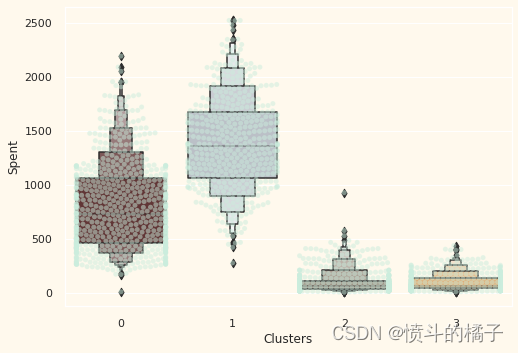
从上图可以清楚地看到,集群1是我们最大的一组客户,紧随其后的是集群0。
我们可以探索每个集群在目标营销策略上的消费情况。
让我们接下来探索一下我们过去的广告活动表现如何。
# 创建一个特征,用于计算接受的促销活动总数
data["Total_Promos"] = data["AcceptedCmp1"]+ data["AcceptedCmp2"]+ data["AcceptedCmp3"]+ data["AcceptedCmp4"]+ data["AcceptedCmp5"]

# 绘制接受的总促销活动数量的计数图
plt.figure()
pl = sns.countplot(x=data["Total_Promos"],hue=data["Clusters"], palette= pal)
pl.set_title("Count Of Promotion Accepted")  # 设置图表标题
pl.set_xlabel("Number Of Total Accepted Promotions")  # 设置x轴标签
plt.show()  # 显示图表
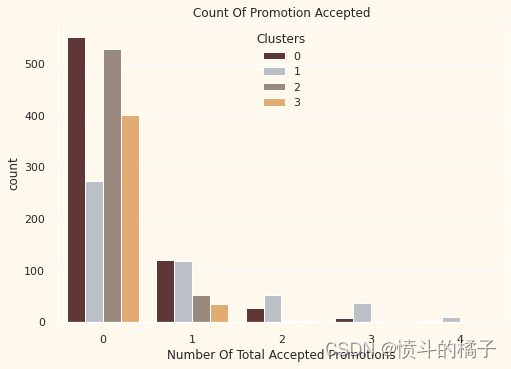
概述
到目前为止,对于这些活动的反应并不强烈。总体参与者很少。此外,没有人参与了其中的全部5个活动。也许需要更有针对性和精心策划的活动来提升销售。
# 创建一个新的图形窗口
plt.figure()

# 绘制盒图,y轴为"NumDealsPurchases"列的数据,x轴为"Clusters"列的数据
# 使用预定义的调色板"pal"来设置颜色
pl = sns.boxenplot(y=data["NumDealsPurchases"], x=data["Clusters"], palette=pal)

# 设置图形标题为"Number of Deals Purchased"
pl.set_title("Number of Deals Purchased")

# 显示图形
plt.show()
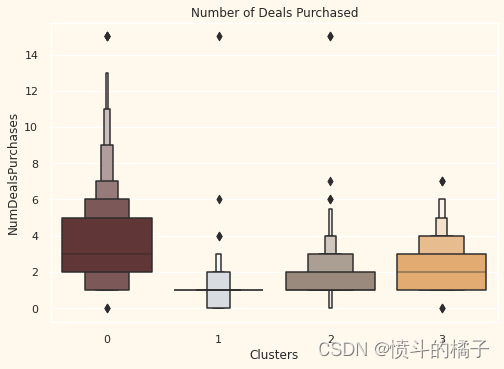
与营销活动不同,所提供的交易表现良好。它在群集0和群集3中有最佳结果。然而,我们的明星客户群集1对交易不太感兴趣。似乎没有什么能够极大地吸引群集2。
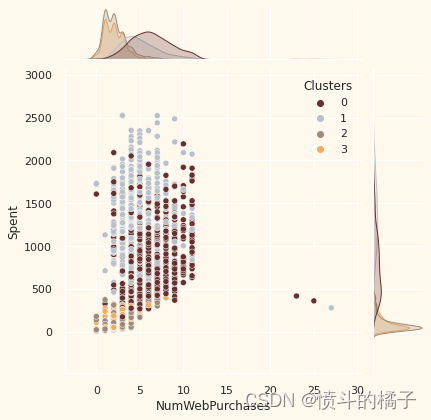
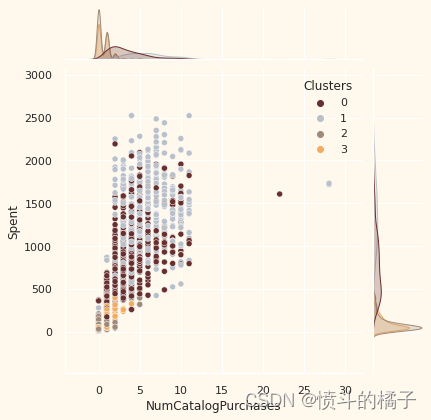
# 定义一个列表变量Places,包含了四个字符串元素,分别表示网购次数、目录购买次数、实体店购买次数和每月网站访问次数

# 遍历Places列表中的每个元素
for i in Places:
    # 创建一个新的图形窗口
    plt.figure()
    # 绘制一个联合分布图,x轴为data[i],y轴为data["Spent"],颜色按照data["Clusters"]进行区分,颜色调色板为pal
    sns.jointplot(x=data[i], y=data["Spent"], hue=data["Clusters"], palette=pal)
    # 显示图形
    plt.show()
<Figure size 576x396 with 0 Axes>
<Figure size 576x396 with 0 Axes>
<Figure size 576x396 with 0 Axes>
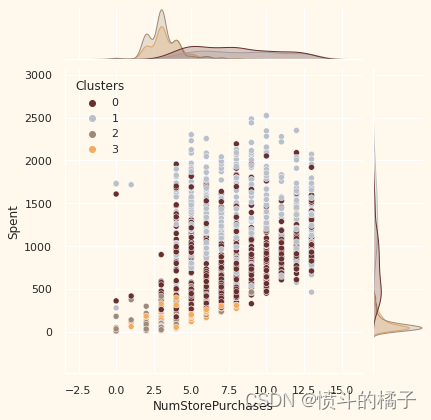
<Figure size 576x396 with 0 Axes>
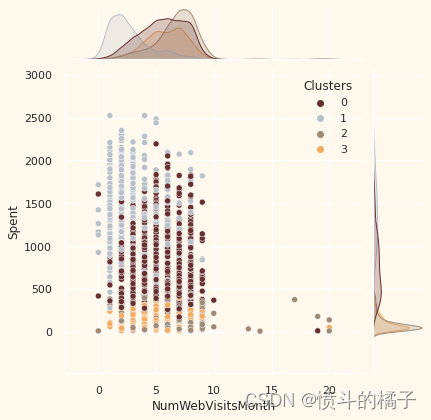
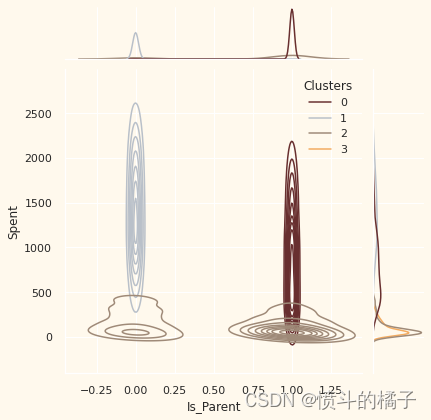
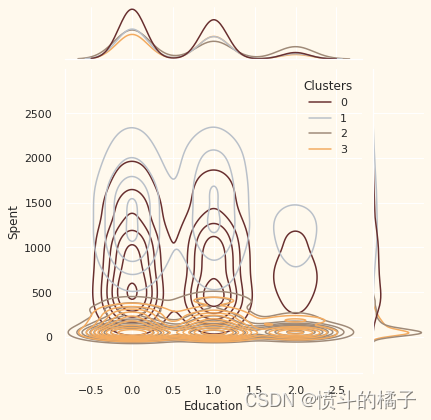
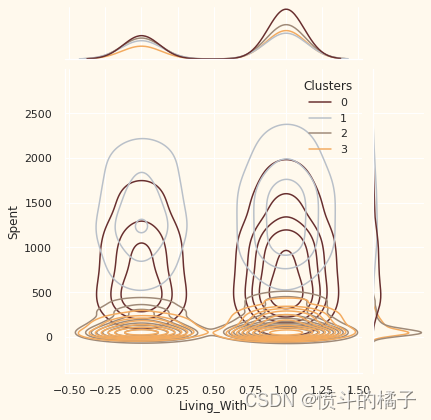
用户画像
现在我们已经形成了聚类并查看了他们的购买习惯。
让我们看看这些聚类中有谁。为此,我们将对形成的聚类进行画像,并得出结论,谁是我们的明星客户,谁需要零售店的营销团队更多的关注。
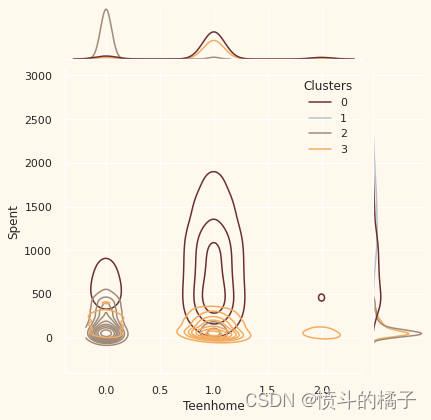
为了决定这一点,我将绘制一些指示客户个人特征的特征,以了解他们所在的聚类。根据结果,我将得出结论。
# 定义个人特征列表
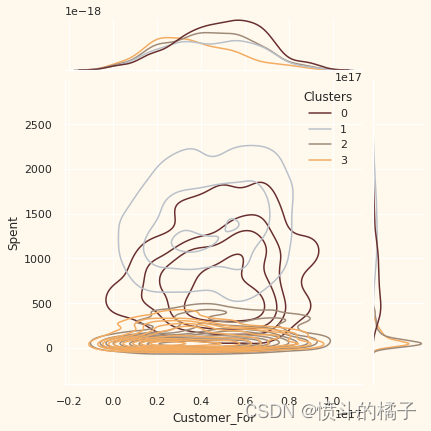
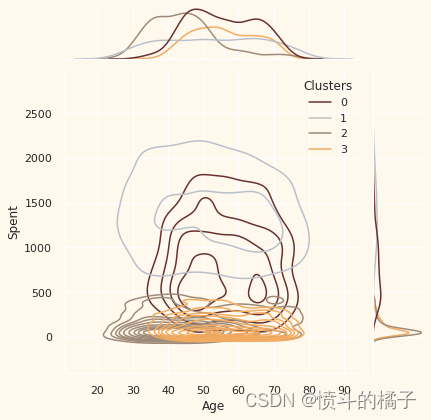
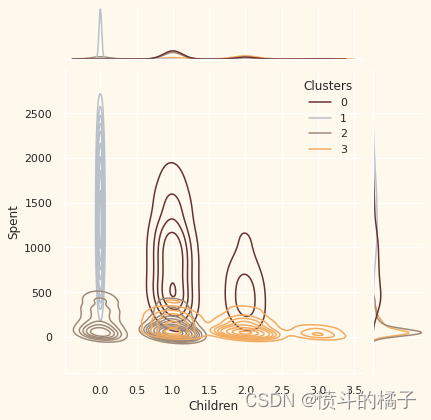
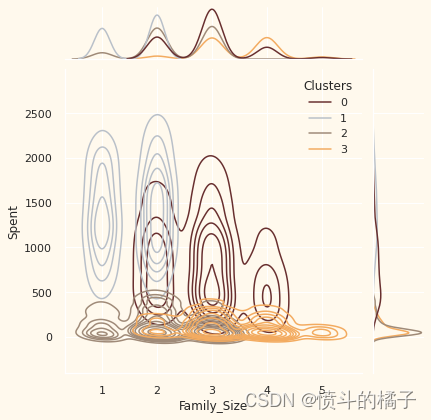
Personal = ["Kidhome", "Teenhome", "Customer_For", "Age", "Children", "Family_Size", "Is_Parent", "Education", "Living_With"]

# 遍历个人特征列表
for i in Personal:
    # 创建一个新的图形
    plt.figure()
    # 绘制联合分布图,x轴为数据中的个人特征i,y轴为数据中的"Spent"特征,根据"Clusters"特征进行着色,使用核密度估计图,颜色使用预定义的调色板pal
    sns.jointplot(x=data[i], y=data["Spent"], hue=data["Clusters"], kind="kde", palette=pal)
    # 显示图形
    plt.show()
<Figure size 576x396 with 0 Axes>
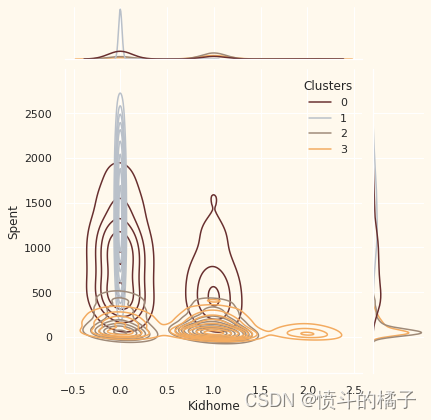
<Figure size 576x396 with 0 Axes>
<Figure size 576x396 with 0 Axes>
<Figure size 576x396 with 0 Axes>
<Figure size 576x396 with 0 Axes>
<Figure size 576x396 with 0 Axes>
<Figure size 576x396 with 0 Axes>
<Figure size 576x396 with 0 Axes>
<Figure size 576x396 with 0 Axes>
需要注意的要点:
可以从不同聚类中推断出以下关于客户的信息。
关于聚类编号:0
? 绝对是父母
? 家庭成员最多为4人,最少为2人
? 单亲家庭是这个群体的一个子集
? 大多数家庭有一个青少年
? 年龄相对较大
关于聚类编号:1
? 绝对不是父母
? 家庭成员最多只有2人
? 比例上,夫妻居多,单身人士次之
? 跨越各个年龄段
? 高收入群体
关于聚类编号:2
? 大多数人是父母
? 家庭成员最多为3人
? 他们主要只有一个孩子(通常不是青少年)
? 年龄相对较小
关于聚类编号:3
? 绝对是父母
? 家庭成员最多为5人,最少为2人
? 大多数家庭有一个青少年
? 年龄相对较大
? 低收入群体
结论
在这个项目中,我进行了无监督聚类。我使用了降维后的凝聚聚类。我得到了4个聚类,并根据他们的家庭结构和收入/支出对聚类中的客户进行了进一步的分析。这可以用于制定更好的营销策略。
代码链接
https://download.csdn.net/download/wjjc1017/88647434
本文来自互联网用户投稿,该文观点仅代表作者本人,不代表本站立场。本站仅提供信息存储空间服务,不拥有所有权,不承担相关法律责任。 如若内容造成侵权/违法违规/事实不符,请联系我的编程经验分享网邮箱:veading@qq.com进行投诉反馈,一经查实,立即删除!