2022年第十一届数学建模国际赛小美赛D题野生动物贸易是否应长期禁止解题全过程文档及程序
2022年第十一届数学建模国际赛小美赛
D题 野生动物贸易是否应长期禁止
原题再现:
??野生动物市场被怀疑是此次疫情和2002年SARS疫情的源头,食用野生肉类被认为是非洲埃博拉病毒的一个来源。在冠状病毒爆发后,中国最高立法机构永久性地加强了野生动物交易规则。冠状病毒被认为起源于武汉的一个野生动物市场。一些科学家推测,一旦疫情结束,应急措施将被取消。
??野生动物产品贸易应如何长期监管?一些研究人员希望无一例外地全面禁止野生动物贸易,而另一些研究人员则表示,一些动物的可持续贸易是可能的,而且对依赖野生动物为生的人们有利。据北京非营利的企业家与生态协会估计,禁止食用野肉可能会使中国经济损失500亿元人民币(71亿美元),并使100万人失业。
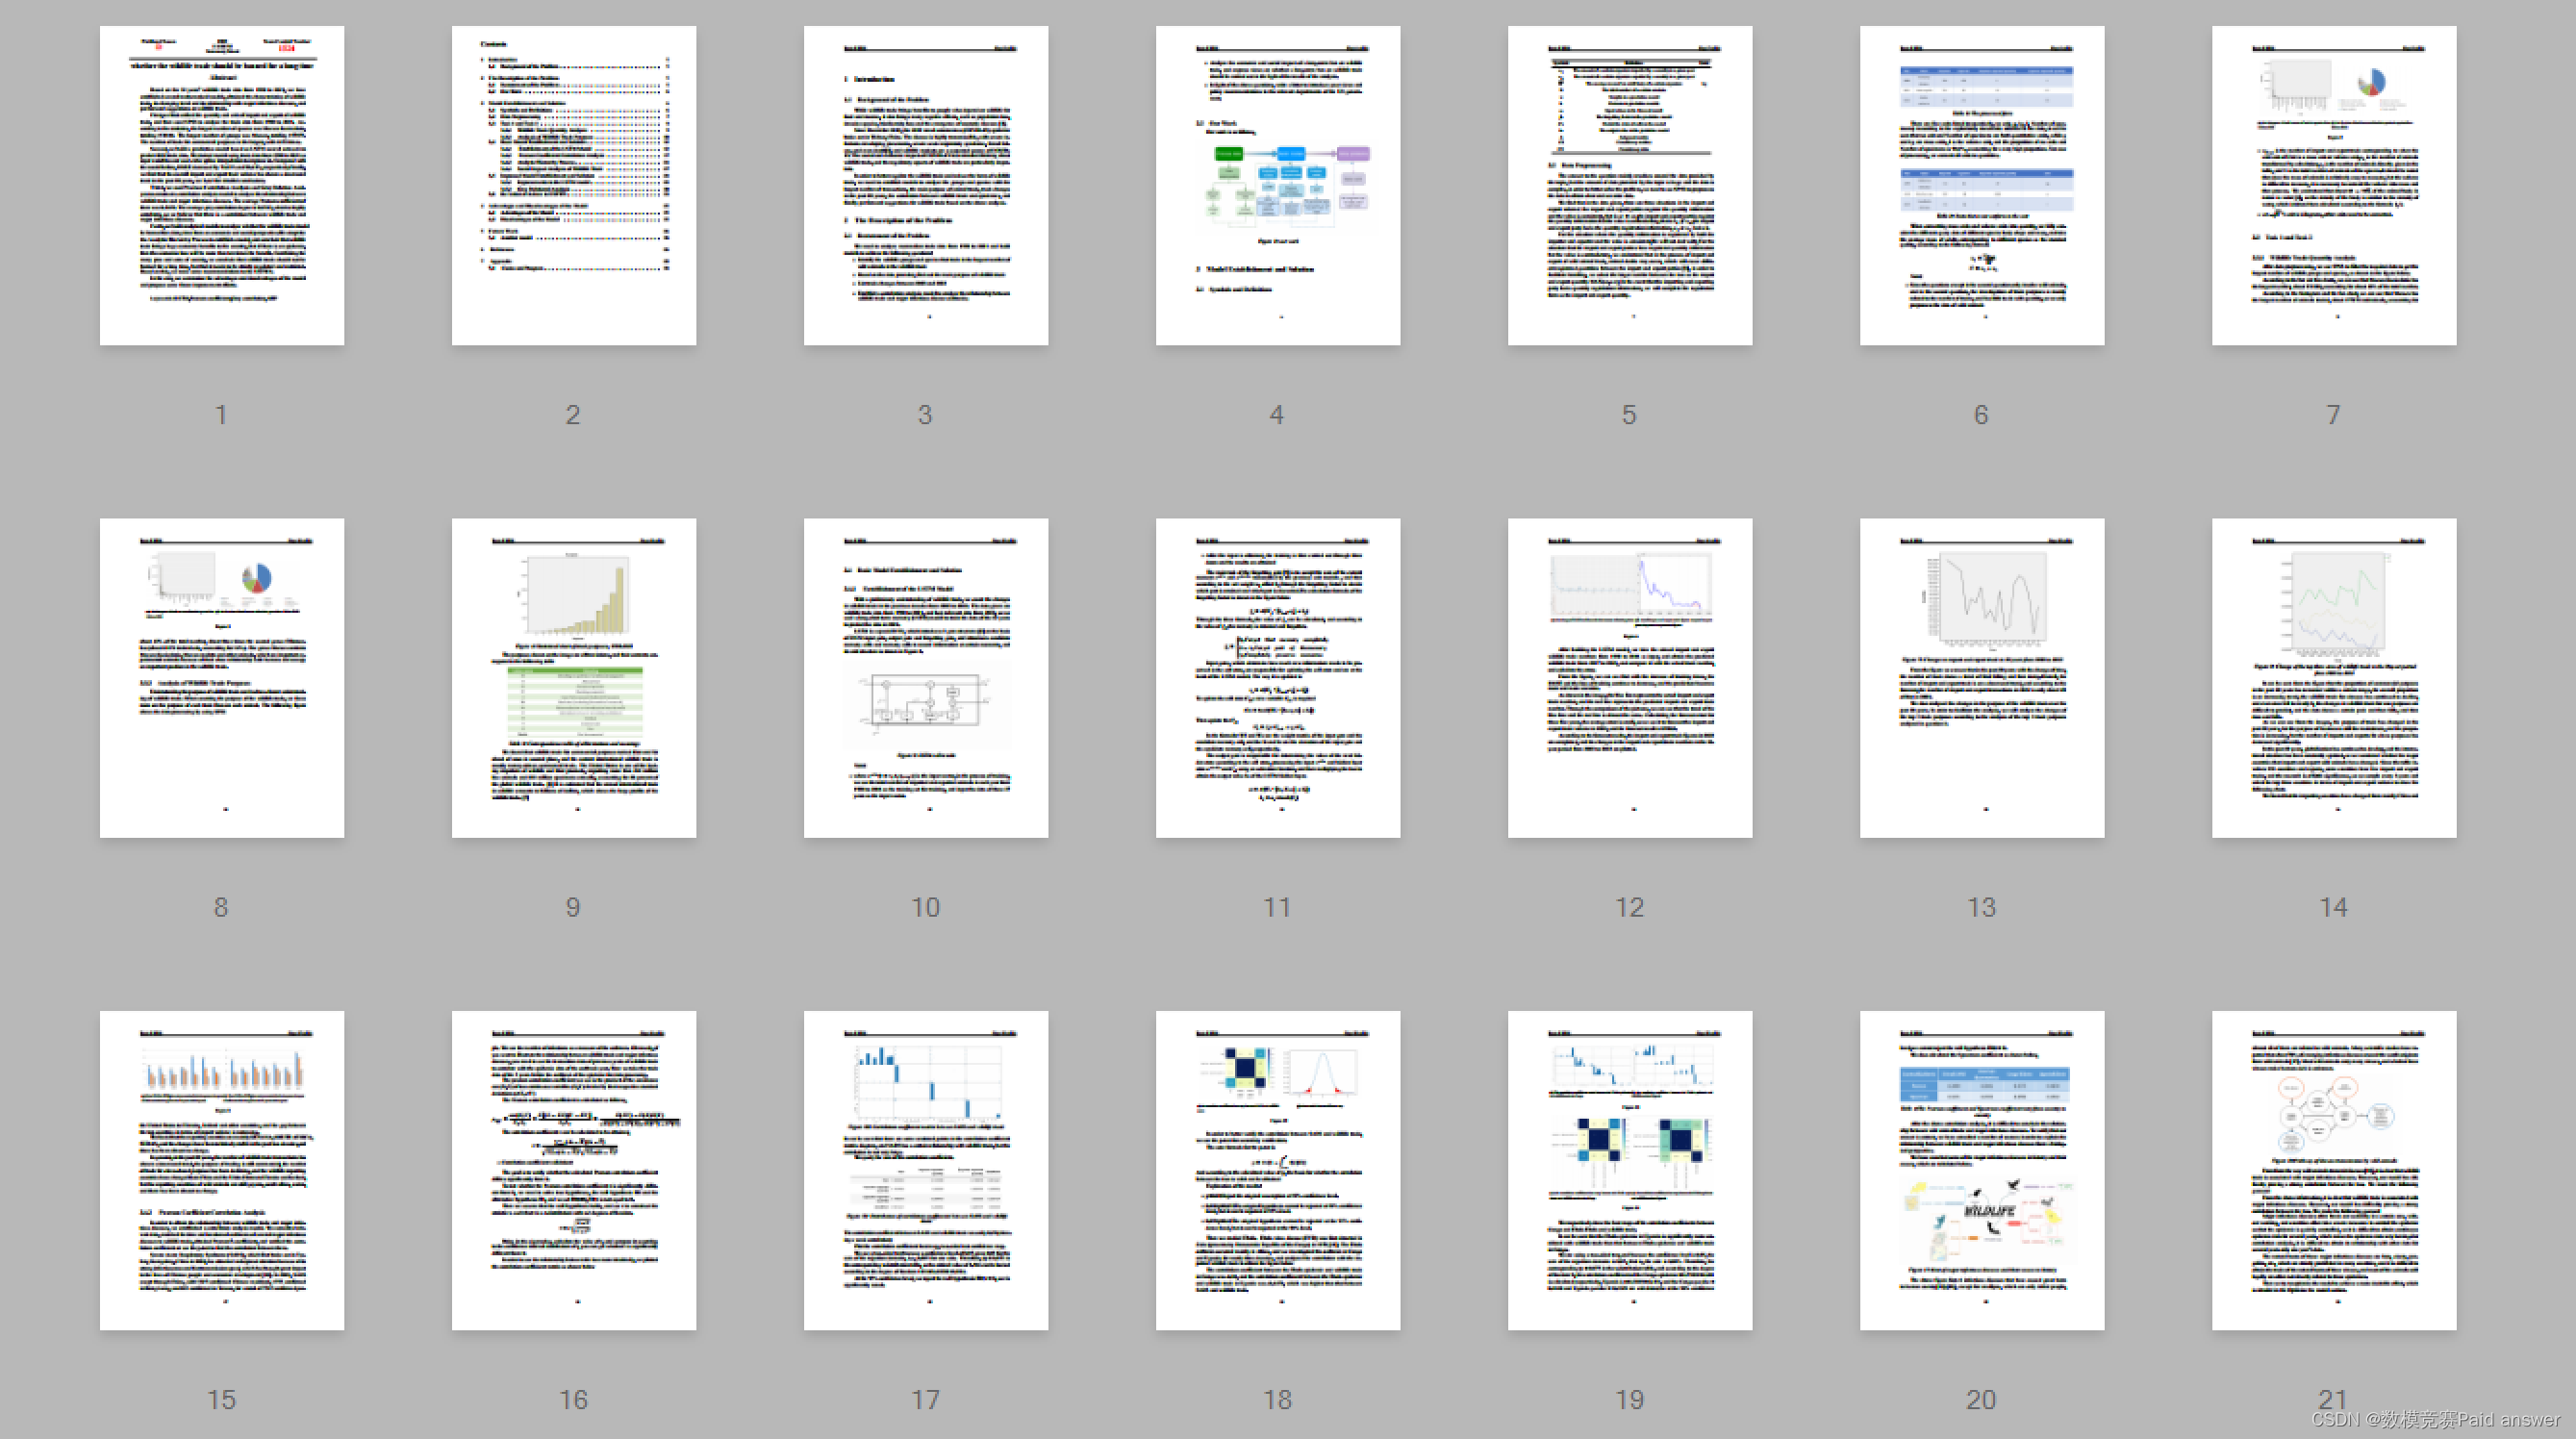
??由中国武汉病毒研究所的李时政和崔洁领导的一个团队,追踪致命SARS病毒的起源,终于在2017年找到了他们的确凿证据。在云南省的一个偏僻洞穴里,病毒学家发现了一个马蹄蝠种群,该种群携带病毒株,与2002年跳到人类身上的病毒株具有相同的基因结构,导致全世界近800人死亡。研究人员于2017年11月30日在《公共科学图书馆·病原体》杂志上发表报告称,这种致命毒株很容易从这种蝙蝠种群中产生。另一个悬而未决的问题是,一种来自云南蝙蝠的病毒如何传播到1000公里以外的广东动物和人类身上,而不会在云南本身造成任何疑似病例。野生动物贸易就是答案。虽然野生动物食用时会高温烹调,但有些病毒很难存活,人类可能会接触到野生动物市场上的动物分泌物。他们警告说,这些成分已经到位,类似的疾病将再次出现。野生动物贸易有许多负面影响,其中最重要的是:

??图1:2002年SARS疫情与中国市场销售的果子狸有关
???人口减少和灭绝
???引入入侵物种
???新疾病向人类传播
??我们使用CITES贸易数据库作为我的数据源。该数据库包含2 000多万份贸易记录,可以公开访问。附件为1990-2021年哺乳动物贸易数据,也可通过以下链接获取完整数据库:https://caiyun.139.com/m/i?0f5ckacoddpej
??要求您的团队建立合理的数学模型,分析数据,并解决以下问题:
??1、哪些野生动物群体和物种的交易量最大(以野生动物为例)?
??2、这些动物的主要贸易目的是什么?
??3、过去二十年(2003-2022年)贸易发生了怎样的变化?
??4、野生动物贸易是否与重大传染病疫情有关?
??5、你同意长期禁止野生动物贸易吗?它是否会对经济和社会产生重大影响,为什么?
??6、致函美国政府有关部门,阐述您的观点和政策建议。
整体求解过程概述(摘要)
??基于1990~2021年32年的野生动物贸易数据,建立了若干数学模型,得出了野生动物贸易的特点、变化趋势及其与主要传染病的关系,并提出了野生动物贸易的建议。
??首先统一了野生动物进出口贸易的数量和单位,然后利用SPSS对1990-2021年的贸易数据进行分析。据统计,食蟹猴种类最多,达151810种。种群数量最多的是猕猴,共计157875只。商业性贸易数量最多,为4453倍。
??其次,建立了基于LSTM神经网络的2022年贸易数据预测模型。以1990-2021年的贸易数据为输入变量对模型进行训练,并采用三次样条插值对模型进行改进,与以前的模型相比,RMSE分别下降了71.63%和90.43%。最后,我们发现,在过去20年中,进出口贸易总额呈现下降趋势,具体结论见3.4.2。
??第三,运用Pearson相关分析和灰色关联分析构建相关分析模型,分析野生动物贸易与主要传染病的关系。平均Pearson系数为0.3429。平均灰色关联度为0.8543,高度相关,因此认为野生动物贸易与主要传染病之间存在一定的相关性。
??第四,建立分析模型,从经济和社会的角度分析野生动物贸易是否应该长期禁止。采用层次分析法建立模型,得出野生动物贸易给国家带来巨大的经济利益,但如果发生疫情,则经济损失将是收益的十倍以上。综合社会的诸多利弊,我们认为野生动物贸易不应长期禁止,而应严格规范和限制。在此基础上,对美国鱼类和野生动物局提出了一些建议。
??最后总结了该模型的优缺点,并提出了今后的改进方向。
模型假设:
??为了便于以下讨论,我们首先假设:
???该数据集具有不可否认的真实性和准确性。
???没有考虑气候变化等外部因素。
问题重述:
??我们需要分析1990年至2021年的哺乳动物贸易数据,并建立模型来解决以下问题:
???确定野生动物贸易中野生动物数量最多的野生动物群体和物种
???根据提供的数据,找出野生动物贸易的主要目的
???列出2003年至2022年间的贸易变化
???建立相关分析模型,分析野生动物贸易与重大传染病暴发之间的关系。
???分析长期禁止野生动物贸易的经济和社会影响,并根据分析结果就是否应实施长期禁止野生动物贸易发表意见。
???针对上述问题,写信向美国政府相关部门介绍您的观点和政策建议。
模型的建立与求解整体论文缩略图


全部论文请见下方“ 只会建模 QQ名片” 点击QQ名片即可
部分程序代码:(代码和文档not free)
1 %LSTM Initial Code
2 clc?clear
3 %% Enter data for 1990-2021
4 data = [0.287259615 0.213347921 0.186021505 0.205663189 0.335515548
0.395131086 0.413533835 0.346978558 0.338954469 0.340277778 0.271653543
0.25748503 0.31122449 0.309278351 0.352941176 0.414772727 0.405844156
0.35125448 0.42019544 0.37804878 0.337595908 0.330218069 0.3081571
0.438709677 0.420849421 0.404761905 0.418867925 0.303501946 0.55
0.520710059 0.472826087 0.428571429]?
5 %% Load the dataset
6 Train_data = data(1:27)? %Training set
7 Text_data = data(28:32)? %Texting set
8 %% Data preprocessing
9 me = mean(Train_data)? %Mean
10 sd = std(Train_data)? %Standard Deviation
11 TrainDataStandard = (Train_data - me) / sd?
12 XTrain = TrainDataStandard(1:end-1)?
13 YTrain = TrainDataStandard(2:end)?
14 %% Build the LSTM neural network
15 FeaturesNum = 1?
16 OutputNum = 1?
17 HiddenNum = 200? %The number of hidden layer units
18 layers = [ ...
19 sequenceInputLayer(FeaturesNum)
20 lstmLayer(HiddenNum)
21 fullyConnectedLayer(OutputNum)
22 regressionLayer]?
23 options = trainingOptions('adam', ...
24 'MaxEpochs',1000, ...
25 'GradientThreshold',1, ...
26 'InitialLearnRate',0.01, ...
27 'LearnRateSchedule','piecewise', ...
28 'LearnRateDropPeriod',400, ...
29 'LearnRateDropFactor',0.15, ...
30 'Verbose',0, ...
31 'Plots','training-progress')?
32 net = trainNetwork(XTrain,YTrain,layers,options)?
33 %% Initialize Network
34 net = predictAndUpdateState(net,XTrain)?
35 [net,predict_y] = predictAndUpdateState(net,YTrain(end))?
36 %% Forecast
37 for i = 2:6
38 [net,predict_y(:,i)] =
predictAndUpdateState(net,predict_y(:,i-1),'ExecutionEnvironment','cpu')?
39 end
40 %% Calculate RMSE
41 predict_y = sd * predict_y + me?
42 RMSE = sqrt(mean((predict_y(1:5)-Text_data).^2)) ?
43 %% Draw a curve
44 subplot(2,1,1)
45 plot(Train_data(1:end))
46 hold on
47 x = 28:(27+5)?
48 plot(x,predict_y(1:5),'.-')
49 hold off
50 xlabel("Time")
51 ylabel("Case")
52 title("Forecast")
53 legend(["Observed" "Forecast"])
54 subplot(2,1,2)
55 plot(data)
56 xlabel("Time")
57 ylabel("Case")
58 title("Dataset")
59 %% Comparison between predicted value and actual value
60 figure(2)
61 x =1990:2021?
62 yy = [Train_data ,predict_y(1:5)]?
63 plot(x,yy,'r') %Including predicted partial curve
64 hold on
65 plot(x,data,'b') %Actual curve
66 hold off
67 xlabel("Time")
68 ylabel("Case")
69 legend(["Predict" "Data"])
70
71 %LSTM Improved Code
72 clc?clear
73 %% Enter data for 1990-2021
74 data0 = [0.287259615 0.213347921 0.186021505 0.205663189 0.335515548
0.395131086 0.413533835 0.346978558 0.338954469 0.340277778 0.271653543
0.25748503 0.31122449 0.309278351 0.352941176 0.414772727 0.405844156
0.35125448 0.42019544 0.37804878 0.337595908 0.330218069 0.3081571
0.438709677 0.420849421 0.404761905 0.418867925 0.303501946 0.55
0.520710059 0.472826087 0.428571429]?
75 %% Complementary data of cubic spline interpolation
76 year =
[1990,1991,1992,1993,1994,1995,1996,1997,1998,1999,2000,2001,2002,2003,2004,2005,2006,2007,2008,2009,2010,2011,2012,2013,2014,2015,2016,2017,2018,2019,2020,2021]?
77 new_x = 1990:0.01:2021
78 data = spline(year,data0,new_x)
79 %% Load the dataset
80 Train_data = data(1:3000)? %Training set
81 Text_data = data(3001:3101)? %Texting set
82 %% Data preprocessing
83 me = mean(Train_data)? %Mean
84 sd = std(Train_data)? %Standard Deviation
85 TrainDataStandard = (Train_data - me) / sd?
86 XTrain = TrainDataStandard(1:end-1)?
87 YTrain = TrainDataStandard(2:end)?
88 %% Build the LSTM neural network
89 FeaturesNum = 1?
90 OutputNum = 1?
91 HiddenNum = 200? %The number of hidden layer units
92 layers = [ ...
93 sequenceInputLayer(FeaturesNum)
94 lstmLayer(HiddenNum)
95 fullyConnectedLayer(OutputNum)
96 regressionLayer]?
97 options = trainingOptions('adam', ...
98 'MaxEpochs',100, ...
99 'GradientThreshold',1, ...
100 'InitialLearnRate',0.01, ...
101 'LearnRateSchedule','piecewise', ...
102 'LearnRateDropPeriod',400, ...
103 'LearnRateDropFactor',0.15, ...
104 'Verbose',0, ...
105 'Plots','training-progress')?
106 net = trainNetwork(XTrain,YTrain,layers,options)?
107 %% Initialize Network
108 net = predictAndUpdateState(net,XTrain)?
109 [net,predict_y] = predictAndUpdateState(net,YTrain(end))?
110 %% Forecast
111 for i = 2:201
112 [net,predict_y(:,i)] =
predictAndUpdateState(net,predict_y(:,i-1),'ExecutionEnvironment','cpu')?
113 end
114 %% Calculate RMSE
115 predict_y = sd * predict_y + me?
116 RMSE = sqrt(mean((predict_y(1:101)-Text_data).^2)) ?
117 %% Draw a curve
118 subplot(2,1,1)
119 plot(Train_data(1:end))
120 hold on
121 x = 3001:(3000+101)?
122 plot(x,predict_y(1:101),'.-')
123 hold off
124 xlabel("Time")
125 ylabel("Case")
126 title("Forecast")
127 legend(["Observed" "Forecast"])
128 subplot(2,1,2)
129 plot(data)
130 xlabel("Time")
131 ylabel("Case")
132 title("Dataset")
133 %% Comparison between predicted value and actual value
134 figure(2)
135 x =1990:0.01:2021?
136 yy = [Train_data ,predict_y(1:101)]?
137 plot(x,yy,'r') %Including predicted partial curve
138 hold on
139 plot(x,data,'b') %Actual curve
140 hold off
141 xlabel("Time")
142 ylabel("Case")
143 legend(["Predict" "Data"])
1 import pandas as pd
2 import numpy as np
3 import matplotlib.pyplot as plt
4 plt.rcParams['font.family'] = ['sans-serif']
5 plt.rcParams['font.sans-serif'] = ['SimHei']
6 plt.rcParams['axes.unicode_minus']=False
7 #data = pd.read_excel('trade_mammals_wild_live_1990_2021.xlsx')
8 #data = pd.read_excel('cn_sars_98-03.xlsx')
9 #data = pd.read_excel('us_covid19_16-21.xlsx')
10 #data = pd.read_excel('cd_ebola_95-19.xlsx')
11 #data = pd.read_excel('ga_ebola_90-13.xlsx')
12 #data = pd.read_excel('ug_ebola_91-11.xlsx')
13 #data = pd.read_excel('us_flu_06-21.xlsx')
14 data = pd.read_excel('us_covid19_16-21_grey.xlsx')
15 data.head()
16 data.info()
17 dsc = data.describe()
18 dsc
19 pd.plotting.scatter_matrix(data, figsize=(20,10), alpha=0.75)
20 plt.show()
21 cor = data.corr() # method='pearson'
22 cor
23 sns.heatmap(cor, cmap='YlGnBu', xticklabels=True, yticklabels=True,
24 annot=True, square=True)
25 from scipy import stats
26 np.set_printoptions(suppress=True) # Scientific notation is not used
27 pd.set_option('display.float_format',lambda x : '%.4f' % x) # Keep 4
significant digits after the decimal point
28 # T-distribution test
29 tp = stats.t.isf(1-0.975, 9)
30 x = np.linspace(-5,5,100)
31 y = stats.t.pdf(x, 9)
32 plt.plot(x,y)
33 plt.vlines(-tp, 0, stats.t.pdf(-tp, 9), colors='orange')
34 plt.vlines(tp, 0, stats.t.pdf(tp, 9), colors='orange')
35 plt.fill_between(x, 0, y, where=abs(x)>tp, interpolate=True, color='r')
36 # P-value test
37 def my_pvalue_pearson(x):
38 col = x.shape[1]
39 col_name = x.columns.values
40 p_val = []
41 for i in range(col):
42 for j in range(col):
43 p_val.append(stats.pearsonr(x[col_name[i]], x[col_name[j]])[1])
44 p_val = pd.DataFrame(np.array(p_val).reshape(col, col),
columns=col_name, index=col_name)
45 return p_val
46 my_pvalue_pearson(data)
47
48 # Analytic Hierarchy Process
49 import numpy as np
50 def ConsisTest(X):
51 # Arithmetic averaging
52 X = np.array(X)
53 sum_X = X.sum(axis=0)
54 (n,n) = X.shape
55 sum_X = np.tile(sum_X,(n,1))
56 stand_X = X/sum_X # Standardized X
57 ## Normalization
58 sum_row = stand_X.sum(axis=1)
59 print("The result of the arithmetic averaging method to find the weights
is:")
60 print(sum_row/n)
61
62 # Eigenvalue method
63 V,E = np.linalg.eig(X)
64 max_value = np.max(V) # Maximum eigenvalue
65 #print("Maximum eigenvalue:",max_value)
66 max_v_index = np.argmax(V)
67 max_eiv = E[:,max_v_index]
68 stand_eiv = max_eiv/max_eiv.sum()
69 print("The result of the weighting of the eigenvalue method is:")
70 print(stand_eiv)
71 print("———————————————————————————————")
72 # Consistency check
73 ## Calculate the consistency metric CI
74 CI = (max_value-n)/(n-1)
75 ## Find the corresponding mean random consistency metric RI
76 RI =
np.array([15,0,0,0.52,0.89,1.12,1.26,1.36,1.41,1.46,1.49,1.52,1.54,1.56,1.58,1.59])
77 ## Calculate the consistency scale CR
78 CR = CI/RI[n]
79 if CR < 0.1:
80 print("CR=",CR,",Less than 0.1, pass the consistency test ")
81 else:
82 print("CR=",CR,",greater than or equal to 0.1, the consistency test
is not passed, please modify the judgment matrix ")
83 return None
84 # ConsisTest(b)
85 b = np.array([[1, 7,3,5],[1/7, 1,1/5,1/3] ,[1/3, 5,1,3],[1/5,3,1/3, 1]])
86 ConsisTest(b)
87
88
89 # Grey Relational Analysis
90 import pandas as pd
91 import numpy as np
92 #xlsx_file = "ug_ebola_91-11_grey_preprocess.xlsx"
93 #xlsx_file = "cn_sars_98-03_grey.xlsx"
94 #xlsx_file = "us_covid19_16-21_grey.xlsx"
95 xlsx_file = "cd_ebola_95-19_grey.xlsx"
96 xlsx_data = pd.read_excel(xlsx_file) # Prevent warnings from popping upx=
pd.DataFrame(xlsx_data)
97 x=x.iloc[:,1:].T
98 # 1、Data averaging processing
99 x_mean=x.mean(axis=1)
100 for i in range(x.index.size):
101 x.iloc[i,:] = x.iloc[i,:]/x_mean[i]
102 # 2、Extract reference and compare queues
103 ck=x.iloc[0,:]
104 cp=x.iloc[1:,:]
105 # The comparison queue is subtracted from the reference queue
106 t=pd.DataFrame()
107 for j in range(cp.index.size):
108 temp=pd.Series(cp.iloc[j,:]-ck)
109 t=t.append(temp,ignore_index=True)
110
111 # Find the maximum difference and minimum difference
112 mmax=t.abs().max().max()
113 mmin=t.abs().min().min()
114 rho=0.5
115
116 #3、Find the correlation coefficient
117 ksi=((mmin+rho*mmax)/(abs(t)+rho*mmax))
118
119 #4、Find the degree of correlation
120 r=ksi.sum(axis=1)/ksi.columns.size
121
122 #5、Relevance sorting
123 result=r.sort_values(ascending=False)
124 print(result)
全部论文请见下方“ 只会建模 QQ名片” 点击QQ名片即可
本文来自互联网用户投稿,该文观点仅代表作者本人,不代表本站立场。本站仅提供信息存储空间服务,不拥有所有权,不承担相关法律责任。 如若内容造成侵权/违法违规/事实不符,请联系我的编程经验分享网邮箱:veading@qq.com进行投诉反馈,一经查实,立即删除!