保姆级 Keras 实现 YOLO v3 三
保姆级 Keras 实现 YOLO v3 三
上一篇 文章中, 我们完成了读标注文件和聚类生成 k k k 个 anchor box, 接下来就是要为特征图的每一个 grid cell ( c h a n n e l s = 75 ) (channels = 75) (channels=75) 打标签了
上面讲为 每一个 grid cell ( c h a n n e l s = 75 ) (channels = 75) (channels=75) 打标签 而不为 每一个 anchor box 打标签 , 其实两句话是同一个意思, 但是最终反应到损失函数计算的时候, 其实是计算每个 grid cell 的 n n n 个通道对应于标签值的损失. 损失函数并不知道什么是 anchor box, 它只管数学上的计算式, 那要计算就需要网络的输出格式与标签格式在数学表达式上的匹配. 将 anchor box 对应的标签信息拉直打平放到 grid cell 的 n n n 个通道中, 那就是网络输出对应的真值了
在 《保姆级 Keras 实现 YOLO v3 一》 中我们知道网络输出有三个特征图, 三个特征图大小成倍递减, 是为了适应不同尺度的目标. 那一个 ground truth 对应这三个特征图的哪一个呢? 又对应某一特征图中的哪一个 grid cell 呢? 一个 grid cell 中有 k k k 个 anchor box, 又对应其中的哪一个呢?
一. 分配 anchor box
在 上一篇 文章中, 我们从小到大排列了 9 9 9 个聚类出来的 anchor box 尺寸, 有三个特征图, 正好一个特征图可以平均分配三个, 所以前三个就分配给预测小目标的 52 × 52 52 \times 52 52×52 的特征图, 中间三个就分配给预测中等大小目标的 26 × 26 26 \times 26 26×26 的特征图, 剩下的三个分配给预测大目标的 13 × 13 13 \times 13 13×13 的特征图. 这样, 每个特征图的每个 grid cell 就分配到了三个 anchor box
二. 正负样本匹配规则
训练的时候输出是未知的, 我们需要 ground truth 来调整网络的参数, 让输出向 ground truth 靠近. 就需要为每一个输出确定一个靠近的真值用于损失计算
由 YOLO v3 网络结构我们知道在一张图像中有 13 × 13 × 3 + 26 × 26 × 3 + 52 × 52 × 3 = 10 , 647 13 × 13 × 3 + 26 × 26 × 3 + 52 × 52 × 3 = 10,647 13×13×3+26×26×3+52×52×3=10,647 个 anchor box, 正负样本的匹配规则如下
- 正样本: 一张图中对于第 j j j 个 ground truth, 找出包含它的中心点的那个 grid cell 的 k k k 个 anchor box, 分别计算 I o U IoU IoU, 选 I o U IoU IoU 最大的那一个 anchor box 当成正样本. 就算 I o U IoU IoU 低于阈值也当成正样本, 要不然就会出现某个 ground truth 没有对应的 anchor box. 一个 anchor box 只能分配给一个 ground truth
- 负样本: 除正样本外, 对第 i i i 个 anchor box, 遍历一张图中所有 ground truth, 记录最大的 I o U IoU IoU 值, 如果最大的 I o U IoU IoU 小于阈值, 那这个 anchor box 就是负样本
- 忽略样本: 除正负样本外, 都为忽略样本
按照上面的规则会有一个小问题, 就是正样本会很少, 因为 ground truth 的数量等于正样本的数量, 而一张图中的目标通常是很少的, 所以就会造成样本不均衡. 要解决这个问题就需要修改一下正样本的匹配规则, 修改后如下
- 正样本: 一张图中对于第 j j j 个 ground truth, 找出包含它的中心点的那个 grid cell 的 k k k 个 anchor box, 分别计算 I o U IoU IoU, 选 I o U IoU IoU 最大的那一个 anchor box 当成正样本. 就算 I o U IoU IoU 低于阈值也当成正样本. 对于剩下的 k ? 1 k -1 k?1 个 anchor box, 如果它与第 j j j 个 ground truth 的 I o U IoU IoU 大于一个较大的阈值, 比如 0.7 0.7 0.7, 都将这些 anchor box 分配为 第 j j j 个 ground truth 的正样本. 一个 anchor box 只能分配给一个 ground truth
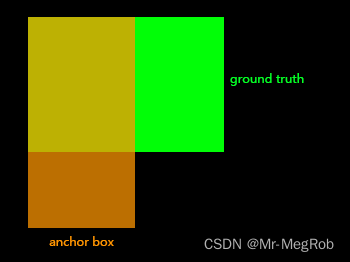
在有一些实现中, 计算正样本的 I o U IoU IoU 时, 将 ground truth 和 anchor box 的一个角移动到相同的位置, 比如下图, 将左上角移动到相同的位置. 计算方式就和聚类时计算 I o U IoU IoU 是一样的

两个方式其实差异不大, 因为 ground truth 和 anchor box 的中心距离并不远, 所以交集面积是差不多的, 甚至大部分计算结果是一样的. 这也就导致了两种计算方式差异不大
三. 为每一个 anchor box 打标签
3.1 anchor box 长什么样?
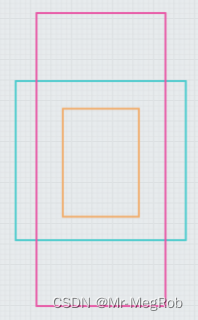
网络输入是 416 × 416 416 \times 416 416×416, 52 × 52 52 \times 52 52×52 的特征图相比于原图缩小了 8 8 8 倍, 所以在原图中每隔 8 8 8 个像素放三个最小尺寸的 anchor box, 三个 anchor box 中心重叠. 如下图, 图中一个小格表示一个像素

26
×
26
26 \times 26
26×26 的特征图缩小了
16
16
16 倍, 所以就是每隔
16
16
16 个像素放三个中等尺寸的 anchor box, 类推
13
×
13
13 \times 13
13×13 特征图每隔
32
32
32 个像素就放最大的三个 anchor box
3.2 每一个 anchor box 标签需要填充的信息有哪些?
我们要预测 anchor box 的修正量 ( Δ x , Δ y , Δ w , Δ h ) (\Delta x, \Delta y, \Delta w, \Delta h) (Δx,Δy,Δw,Δh), 类别( 20 20 20 类), 还有要有一个置信度 C ∈ [ 0 , 1 ] C \in [0, 1] C∈[0,1], 所以一个 anchor box 需要的参数有 25 25 25 个, 一个 grid cell 有 3 3 3 个 anchor box, 所以一个 grid cell 需要 75 75 75 个参数, 这 75 75 75 个参数就填充一个 grid cell 的 75 75 75 个通道, 3 3 3 个 anchor box 的数据依次排列即可, 你要喜欢也可以按你想的顺序排列

3.3 ( Δ x , Δ y , Δ w , Δ h ) (\Delta x, \Delta y, \Delta w, \Delta h) (Δx,Δy,Δw,Δh) 怎么填?
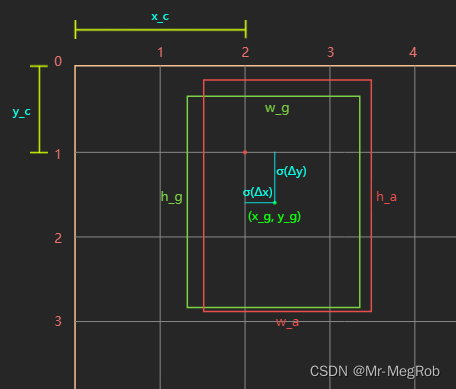
我们要清楚一点, 网络对目标位置预测的是对于 anchor box 变换到 ground truth 的修正量 ( Δ x , Δ y , Δ w , Δ h ) (\Delta x, \Delta y, \Delta w, \Delta h) (Δx,Δy,Δw,Δh), 而不是直接预测目标的绝对坐标位置, 现在看图说话

上图中, 绿色框表示 ground truth, 坐标表示形式是
(
x
,
y
,
w
,
h
)
(x, y, w, h)
(x,y,w,h), 其中
x
,
y
x, y
x,y 表示中心坐标,
w
,
h
w, h
w,h 表示宽和高, 对应到图中便是
(
x
g
,
y
g
,
w
g
,
h
g
)
(x_g, y_g, w_g, h_g)
(xg?,yg?,wg?,hg?), 红色框表示一个 anchor box. 它的中心是 grid cell 的坐标
(
x
c
,
y
c
)
(x_c, y_c)
(xc?,yc?), 其宽和高分别是
w
a
,
h
a
w_a, h_a
wa?,ha?. 好了, 现在我们用网络的输出
(
t
x
,
t
y
,
t
w
,
t
h
)
(t_x, t_y, t_w, t_h)
(tx?,ty?,tw?,th?) 来修正 anchor box, 之所以用
(
t
x
,
t
y
,
t
w
,
t
h
)
(t_x, t_y, t_w, t_h)
(tx?,ty?,tw?,th?) 来表示预测值, 是因为我们要用
(
Δ
x
,
Δ
y
,
Δ
w
,
Δ
h
)
(\Delta x, \Delta y, \Delta w, \Delta h)
(Δx,Δy,Δw,Δh) 来表示标签值. 不要弄混了. 公式如下
x
g
=
σ
(
t
x
)
+
x
c
y
g
=
σ
(
t
y
)
+
y
c
w
g
=
w
a
e
t
w
h
g
=
h
a
e
t
h
\begin{aligned} x_g&= \sigma(t_x) + x_c \\ y_g &= \sigma(t_y) + y_c \\ w_g &= w_ae^{t_w} \\ h_g &= h_ae^{t_h} \\ \end{aligned}
xg?yg?wg?hg??=σ(tx?)+xc?=σ(ty?)+yc?=wa?etw?=ha?eth??
其中
σ
(
x
)
=
1
/
(
1
+
e
?
x
)
\sigma(x) = 1 / (1 + e^{-x})
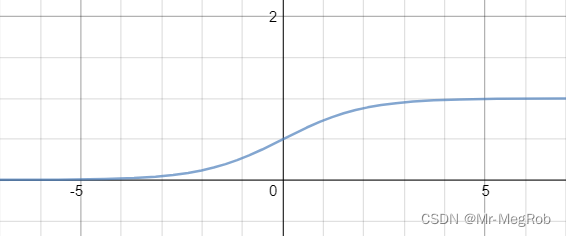
σ(x)=1/(1+e?x), 函数图像如下

所以 σ ( t x ) ∈ ( 0 , 1 ) \sigma(t_x) \in (0, 1) σ(tx?)∈(0,1), σ ( t y ) ∈ ( 0 , 1 ) \sigma(t_y) \in (0, 1) σ(ty?)∈(0,1). 这样就将中心点限制在了 grid cell 内部. 而用 e e e 指数则可以保证 w a e t w w_ae^{t_w} wa?etw? 和 h a e t h h_ae^{t_h} ha?eth? 大于 0, 因为 w g w_g wg? 和 h g h_g hg? 必须大于 0
所以, 我们希望网络的输出 ( t x , t y , t w , t h ) (t_x, t_y, t_w, t_h) (tx?,ty?,tw?,th?) 代入上面的公式之后, 能得到或者接近 ( x g , y g , w g , h g ) (x_g, y_g, w_g, h_g) (xg?,yg?,wg?,hg?) , 但是 ( t x , t y , t w , t h ) (t_x, t_y, t_w, t_h) (tx?,ty?,tw?,th?) 的值要是多少才合适呢?
(
x
g
,
y
g
,
w
g
,
h
g
)
(x_g, y_g, w_g, h_g)
(xg?,yg?,wg?,hg?),
(
x
c
,
y
c
,
w
a
,
h
a
(x_c, y_c, w_a, h_a
(xc?,yc?,wa?,ha?) 是已知量, 解上面的等式就可以得到
(
t
x
,
t
y
,
t
w
,
t
h
)
(t_x, t_y, t_w, t_h)
(tx?,ty?,tw?,th?),
t
x
=
l
n
(
x
g
?
x
c
1
?
x
g
+
c
x
)
t
y
=
l
n
(
y
g
?
y
c
1
?
y
g
+
c
y
)
t
w
=
l
n
(
w
g
w
a
)
t
h
=
l
n
(
h
g
h
a
)
\begin{aligned} t_x &= ln({{x_g - x_c} \over {1 - x_g + c_x}}) \\ t_y &= ln({{y_g - y_c} \over {1 - y_g + c_y}}) \\ t_w &= ln({w_g \over {w_a}}) \\ t_h &= ln({h_g \over {h_a}}) \\ \end{aligned}
tx?ty?tw?th??=ln(1?xg?+cx?xg??xc??)=ln(1?yg?+cy?yg??yc??)=ln(wa?wg??)=ln(ha?hg??)?
现在, 解出来的
(
t
x
,
t
y
,
t
w
,
t
h
)
(t_x, t_y, t_w, t_h)
(tx?,ty?,tw?,th?) 就是标签值
(
Δ
x
,
Δ
y
,
Δ
w
,
Δ
h
)
(\Delta x, \Delta y, \Delta w, \Delta h)
(Δx,Δy,Δw,Δh)
x c , y c x_c, y_c xc?,yc? 有必要要另外说明一下, 两个都是整数, 因为它们是 grid cell 的坐标, 范围是 [ 0 , [0, [0, 特征图尺寸 ? 1 ] - 1] ?1], 如果哪一个 grid cell 中的 anchor box 负责预测目标, 那么这个 anchor box 的一部分坐标就已知了, 剩下的就是预测这个 anchor box 的中心坐标相对于这个 grid cell 左上角坐标 ( x c , y c ) (x_c, y_c) (xc?,yc?) 的偏移量.
还是以上面的图用具体的数字来说明, 假设上面的图是 52 × 52 52 \times 52 52×52 的特征图对应的原图, 那一个格子宽度是 8 个像素, 一个格子对应特征图一个 grid cell, 此时 ground truth 绝对坐标是 ( 18.82 , 12.98 , 17 , 20 ) (18.82, 12.98, 17, 20) (18.82,12.98,17,20), anchor box 的尺寸是 ( 16 , 22 ) (16, 22) (16,22). 从图中可以看到 c x = 2 , c y = 1 c_x = 2, c_y = 1 cx?=2,cy?=1, 则 σ ( Δ x ) = 0.3525 , σ ( Δ y ) = 0.6225 \sigma(\Delta x) = 0.3525, \sigma(\Delta y) = 0.6225 σ(Δx)=0.3525,σ(Δy)=0.6225, 0.3525 0.3525 0.3525 和 0.6225 0.6225 0.6225 这两个数字怎么来的?
因为 ground truth 中心点绝对坐标是
(
18.82
,
12.98
)
(18.82, 12.98)
(18.82,12.98), 相对于 grid cell 左上角的坐标是
(
18.82
?
8
x
c
,
12.98
?
8
y
c
)
=
(
2.82
,
4.98
)
(18.82 - 8x_c, 12.98 - 8y_c) = (2.82, 4.98)
(18.82?8xc?,12.98?8yc?)=(2.82,4.98)
再将
(
2.82
,
4.98
)
(2.82, 4.98)
(2.82,4.98) 以步长
8
8
8 为分母归一化得到
(
0.3525
,
0.6225
)
(0.3525, 0.6225)
(0.3525,0.6225), 所以 ground truth 归一化后的中心坐标为
(
2.3525
,
1.6225
)
(2.3525, 1.6225)
(2.3525,1.6225), 公式中的
(
x
g
,
y
g
)
(x_g, y_g)
(xg?,yg?) 就是归一化后的坐标. 如果要还原成绝对坐标, 将
(
2.3525
,
1.6225
)
(2.3525, 1.6225)
(2.3525,1.6225) 乘以
8
8
8 就可以得到
(
18.82
,
12.98
)
(18.82, 12.98)
(18.82,12.98)
反解
σ
(
Δ
x
)
=
0.3525
,
σ
(
Δ
y
)
=
0.6225
\sigma(\Delta x) = 0.3525, \sigma(\Delta y) = 0.6225
σ(Δx)=0.3525,σ(Δy)=0.6225, 再将
w
g
,
h
g
,
w
a
,
h
a
w_g, h_g, w_a, h_a
wg?,hg?,wa?,ha? 再入
Δ
w
=
l
n
(
w
g
w
a
)
Δ
h
=
l
n
(
h
g
h
a
)
\begin{aligned} \Delta w &= ln({w_g \over {w_a}}) \\ \Delta h &= ln({h_g \over {h_a}}) \\ \end{aligned}
ΔwΔh?=ln(wa?wg??)=ln(ha?hg??)?
将就可以解出
(
Δ
x
,
Δ
y
,
Δ
w
,
Δ
h
)
=
(
?
0.608068
,
0.500173
,
0.060625
,
?
0.095310
)
(\Delta x, \Delta y, \Delta w, \Delta h) = (-0.608068, 0.500173, 0.060625, -0.095310)
(Δx,Δy,Δw,Δh)=(?0.608068,0.500173,0.060625,?0.095310), 所以这个 anchor box 的关于位置的标签值就是
(
?
0.608068
,
0.500173
,
0.060625
,
?
0.095310
)
(-0.608068, 0.500173, 0.060625, -0.095310)
(?0.608068,0.500173,0.060625,?0.095310)
其实将
σ
(
Δ
x
)
\sigma(\Delta x)
σ(Δx) 与
σ
(
Δ
y
)
\sigma(\Delta y)
σ(Δy) 限制在
(
0
,
1
)
(0, 1)
(0,1) 是有一点问题的, 因为
Δ
x
\Delta x
Δx 和
Δ
y
\Delta y
Δy 趋于
?
∞
-\infty
?∞ 时
σ
(
x
)
\sigma(x)
σ(x) 才能取到
0
0
0, 趋于
+
∞
+\infty
+∞ 时
σ
(
x
)
\sigma(x)
σ(x) 才能取到
1
1
1. 所以当 ground truth 中心点在 grid cell 边界的时候是学习不到这个值的. 不过这个也不是什么大问题, 当
∣
t
x
∣
|t_x|
∣tx?∣ 和
∣
t
y
∣
|t_y|
∣ty?∣ 大于
5
5
5 后, 就已经很接近了. 但是打标签会有问题, 因为按上面的公式计算出来的值是
?
∞
-\infty
?∞ 或者
+
∞
+\infty
+∞. 为了解决一个问题, 可以有两种方法, 一是打标签的时候, 把标签值的绝对值限制在某个范围内, 比如
5
5
5,
σ
(
5
)
=
0.9933071491
\sigma(5)=0.9933071491
σ(5)=0.9933071491, 算是一个比较接近的数了. 另一个更好的方法是在 将
σ
(
x
)
\sigma(x)
σ(x) 修改成
k
σ
(
x
)
?
b
k\sigma(x) -b
kσ(x)?b
其中
k
>
1
,
b
>
0
k > 1, b > 0
k>1,b>0. 假设
k
=
2
,
b
=
0.5
k = 2, b = 0.5
k=2,b=0.5, 这样的话, 假设
2
σ
(
Δ
x
)
?
0.5
=
0.99
2\sigma(\Delta x) - 0.5 = 0.99
2σ(Δx)?0.5=0.99, 则标签值
Δ
x
=
1.072120
\Delta x = 1.072120
Δx=1.072120, 假设
2
σ
(
Δ
x
)
?
0.5
=
0.01
2\sigma(\Delta x) - 0.5 = 0.01
2σ(Δx)?0.5=0.01, 则标签值
Δ
x
=
?
1.072120
\Delta x = -1.072120
Δx=?1.072120, 这很合理. 这就是在 YOLO v4 中的改进方法, 本文就选这种方法修正这个问题
3.4 类别标签怎么填?
这个很简单, 20 20 20 个类别, 只要按 one-hot 编码填进去就可以了, 在 3.2 3.2 3.2 节的图中就是一个例子
3.5 置信度标签怎么填?
这个更简单, 如果是负样本填 0 0 0, 正样本就填 1 1 1, 忽略的样本呢? 这个看你的心情了, 只要不是 0 0 0 或者 1 1 1 就行, 为了更好的区分, 我就填 ? 1 -1 ?1
四. 打标签代码
既然要为 anchor box 打标签, 那首先要生成 anchor box
# 生成 anchor box 函数
# image_size: 图像尺寸
# anchor_size: 聚类生成的 anchor box 尺寸
def create_anchors(image_size, anchor_size):
    # 生成基础的 k 个 anchor box
    base_anchors = []
    for s in anchor_size:
        base_anchors.append((-s[0] // 2, -s[1] // 2, s[0] // 2, s[1] // 2))

    grid_anchors = len(anchor_size) // 3 # 每个特征图中一个 grid cell 包含的 anchor box 的数量
    anchor_boxes = [] # 存放各特征图生成的 anchor box 的列表

    # 生成三种尺寸特征图的 anchor box
    for i, stride in enumerate(STRIDES):
        # 特征图尺寸
        feature_rows = image_size[0] // stride
        feature_cols = image_size[1] // stride
        # 中心坐标
        ax = (tf.cast(tf.range(feature_cols), tf.float32)) * stride + stride // 2
        ay = (tf.cast(tf.range(feature_rows), tf.float32)) * stride + stride // 2
        ax, ay = tf.meshgrid(ax, ay)

        # 变换形状方便下面的 tf.stack
        ax = tf.reshape(ax, (-1, 1))
        ay = tf.reshape(ay, (-1, 1))

        # stack([ax, ay, ax, ay]) 成这样的格式, 是为了分别加上 base_anchor 的左上角坐标和右下角坐标
        boxes = tf.stack([ax, ay, ax, ay], axis = -1)
        # boxes: (x1, y1, x2, y2) = 中心坐标 + base_anchors, 一种尺寸的特征图取 3 个 anchor box
        boxes = boxes + base_anchors[i * grid_anchors: i * grid_anchors + grid_anchors]

        anchor_boxes.append(boxes)

    # 将三个特征图的 anchor box 放到一个 Tensor 中, 最后 shape == (n, 4)
    feature_boxes = tf.concat([anchor_boxes[0], anchor_boxes[1], anchor_boxes[2]], axis = 0)
    feature_boxes = tf.reshape(feature_boxes, (-1, 4))

    return feature_boxes
测试 create_anchors 函数
# 测试 create_anchors 函数
anchor_boxes = create_anchors((LONG_SIDE, LONG_SIDE), cluster_anchors)
print(anchor_boxes)
打印结果
tf.Tensor(
[[ -4.  -7.  12.  15.]
 [ -9. -25.  17.  33.]
 [-20. -13.  28.  21.]
 ...
 [277. 333. 522. 467.]
 [322. 286. 478. 514.]
 [245. 268. 555. 531.]], shape=(10647, 4), dtype=float32)
因为打标签时会用到 I o U IoU IoU, 所以先定义一个函数计算 I o U IoU IoU
# 计算 IoU 函数
# gt_box: 一个标注框
# anchor_boxes: n 个 anchor box, shape = (n, 4)
def get_iou(gt_box, anchor_boxes):
    x = tf.maximum(gt_box[0], anchor_boxes[:, 0])
    y = tf.maximum(gt_box[1], anchor_boxes[:, 1])
    w = tf.maximum(tf.minimum(gt_box[2], anchor_boxes[:, 2]) - x, 0)
    h = tf.maximum(tf.minimum(gt_box[3], anchor_boxes[:, 3]) - y, 0)

    intersection = w * h

    gt_area = (gt_box[2] - gt_box[0]) * (gt_box[3] - gt_box[1])
    box_area = (anchor_boxes[:, 2] - anchor_boxes[:, 0]) * (anchor_boxes[:, 3] - anchor_boxes[:, 1])

    union = gt_area + box_area - intersection
    ious = intersection / union
    return tf.reshape(ious, (-1, 1))
测试 I o U IoU IoU
# 测试 IoU
a = (8, 8, 32, 64)
b = [(3, 3, 32, 65), (6, 3, 35, 70), (20, 15, 40, 70), (80, 100, 128, 160)]
print("iou(a, b) =", get_iou(a, np.array(b)))
测试结果
iou(a, b) = tf.Tensor(
[[0.74749722]
 [0.69171384]
 [0.31681034]
 [0.        ]], shape=(4, 1), dtype=float64)
在打位置标签 ( Δ x , Δ y , Δ w , Δ h ) (\Delta x, \Delta y, \Delta w, \Delta h) (Δx,Δy,Δw,Δh) 的时候, 需要作一些计算, 我们把这些计算也放到一个函数中去方便使用
# 位置标签函数
# gt_box: 一个标注框
# anchor_boxes: 一张图中所有 anchor box
def get_delta(gt_box, anchor_boxes):
    # 返回值, 返回一个 gt_box 与所有 anchor box 之间的修正量
    # 计算时把所有的 anchor box 当成正样本, 后面会根据 IoU 筛选出真正的正样本
    deltas = None

    # gt_box 在原图中的 (x, y, w, h) 形式坐标
    gt_x = (gt_box[0] + gt_box[2]) * 0.5
    gt_y = (gt_box[1] + gt_box[3]) * 0.5
    gt_w = (gt_box[2] - gt_box[0])
    gt_h = (gt_box[3] - gt_box[1])

    # anchor box 在原图中的宽和高
    a_w = anchor_boxes[..., 2] - anchor_boxes[..., 0]
    a_h = anchor_boxes[..., 3] - anchor_boxes[..., 1]

    # 每种特征图的 anchor box 数量 (52 × 52 × 3, 26 × 26 × 3, 13 × 13 × 3)
    anchor_num = [(LONG_SIDE // s) * (LONG_SIDE // s) * 3 for s in STRIDES]

    # 不同特征图 anchor box 切片索引
    idx_start = 0
    idx_end = anchor_num[0]

    for i in (0, 1, 2):
        # gt_box 中心点在特征图中距 grid cell 左上角的距离
        dist_x = tf.constant(gt_x / STRIDES[i] - round(gt_x) // STRIDES[i],
                             shape = (anchor_num[i],), dtype = tf.float32)
        dist_y = tf.constant(gt_y / STRIDES[i] - round(gt_y) // STRIDES[i],
                             shape = (anchor_num[i],), dtype = tf.float32)

        # 坐标计算公式为 2 * sigma(x) - 0.5
        delta_x = tf.math.log((0.5 + dist_x) / (1.5 - dist_x))
        delta_y = tf.math.log((0.5 + dist_y) / (1.5 - dist_y))

        # 每个尺寸的特征图的 anchor box 数量不一样, 所以要加以区分
        delta_w = tf.math.log(gt_w / a_w[idx_start: idx_end])
        delta_h = tf.math.log(gt_h / a_h[idx_start: idx_end])

        idx_start = idx_end
        idx_end = idx_end + (anchor_num[i + 1] if i < 2 else sum(anchor_num))

        if None == deltas:
            deltas = tf.stack([delta_x, delta_y, delta_w, delta_h], axis = -1)
        else:
            deltas = tf.concat([deltas, tf.stack([delta_x, delta_y, delta_w, delta_h], axis = -1)], axis = 0)

    return deltas
为了方便计算, get_delta 在函数内部我们假设所有的 anchor box 都是正样本, 这样计算也不影响, 因为损失函数中我们只关心真正的正样本, 至于其他样本是什么值并不影响
因为只有 ground truth 中心所在的 grid cell 中的 k k k 个 anchor box 才负责预测, 所以我们要把这 k k k 个 anchor box 的序号找出来, 方便后面函数的操作
# 计算 ground truth 所在 grid cell 的 k 个 anchor box 的序号
# 一共有 10647 个, 返回的是在三个特征图中的位置序号
def get_valid_idx(gt_box):
    # 每种特征图的 anchor box 数量 (52 × 52 × 3, 26 × 26 × 3, 13 × 13 × 3)
    anchor_num = [(LONG_SIDE // s) * (LONG_SIDE // s) * 3 for s in STRIDES]
    # 一个 grid cell 中的 anchor box 数量
    grid_anchors = (CLUSTER_K // 3)

    # gt_box 在原图的中心坐标
    x = (gt_box[0] + gt_box[2]) * 0.5
    y = (gt_box[1] + gt_box[3]) * 0.5

    # 后面的特征图中 anchor box 的序号要加上前面的特征图的总的 anchor box 的数量
    offset = [0, anchor_num[0], anchor_num[0] + anchor_num[1]]

    # 返回值
    ret_idx = []

    for i in (0, 1, 2):
        grid_x = round(x) // STRIDES[i]
        grid_y = round(y) // STRIDES[i]
        # 在各特征图中的起始序号
        idx_start = grid_y * (LONG_SIDE //  STRIDES[i]) * grid_anchors + grid_x * grid_anchors + offset[i]
        ret_idx.append(idx_start)
        # 后面 grid_anchors - 1 个 anchor box 序号顺序增加
        for j in range(1, grid_anchors):
            ret_idx.append(ret_idx[-1] + 1)

    return ret_idx
# 测试 get_valid_idx 函数
valid_boxes = get_valid_idx((0, 0, 8, 8))
print(valid_boxes)
输出结果
[0, 1, 2, 8112, 8113, 8114, 10140, 10141, 10142]
现在定义一个函数, 为一张图像的 anchor box 打标签
# 定义打标签函数
# gts: get_ground_truth 函数的第三个返回值, 前两个在这里用不上, 所以下面的循环中只用了最后一个
# anchor_boxes: create_anchors 函数生成的 anchor box
def get_label(gts, anchor_boxes):
    # 总的 anchor box 数量
    anchor_nums = anchor_boxes.shape[0]
     # 类别数量
    categories = len(CATEGORIES)

    # 位置标签(Δx,Δy,Δw,Δh), 全部初始化为 0
    deltas = tf.zeros((anchor_nums, 4), dtype = tf.float32)
    # 各 gt_box 与 anchor box 的最大 IoU, 要比较各 gt_box 与所有 anchor box IoU 的大小
    # 把最大值记录下来, 这样将标签分配给最合适的 anchor box, 还有一个功能是用来判断是否是负样本
    max_ious = tf.zeros((anchor_nums, 1), dtype = tf.float32)
    # 类别标签, 全部初始化为 0
    cls_ids = tf.zeros((anchor_nums, categories), dtype = tf.float32)
    # 置信度标签, 全部初始化为 -1, 表示忽略样本
    confidence = tf.fill((anchor_nums, 1), -1.0)

    for gt_box, cls_id in gts[-1]:
        # 所有 anchor box 的可用状态, 只有 gt_box 所在 grid cell 的 k 个 anchor box 可用, 先全部初始化为 False
        valid_mask = tf.fill((anchor_nums, 1), False)
        # 取出 gt_box 所在 grid cell 的 k 个 anchor box 的序号
        indices = get_valid_idx(gt_box)
        indices = tf.reshape(tf.constant(indices), (-1, 1))
        updates = tf.constant(True, shape = indices.shape)
        # 将序号位置的 False 变成 True
        valid_mask = tf.tensor_scatter_nd_update(valid_mask, indices, updates)

        # 正常计算 IoU
        # ious = get_iou(gt_box, anchor_boxes)

        # 聚类方式计算 IoU, gt_box 与 所有 anchor box 的 IoU, 左上角都在 (0, 0)
        ious = cluster_iou((gt_box[2] - gt_box[0], gt_box[3] - gt_box[1]),
                           tf.stack([anchor_boxes[:, 2] - anchor_boxes[:, 0],
                                     anchor_boxes[:, 3] - anchor_boxes[:, 1]], axis = -1))
        # 聚类方式计算 IoU 结果要变换到合适的 shape
        ious = tf.reshape(ious, (anchor_nums, -1))

        # 屏蔽掉其他 grid cell 的 IoU
        ious = tf.where(valid_mask, ious, 0.0)

        # 找出最大值所在的位置
        grater_mask = ious > max_ious
        # 记录每次比较的最大值, 这个是在不同的 gt_box 这间比较
        max_ious = tf.maximum(ious, max_ious)

        # 获取当前 gt_box 与 anchor box IoU 最大值和对应的索引,
        # k = 1, 表示我们只关心最大的一个, 这个也许是小于阈值的, 但是我们也要将其变成正样本
        _, indices = tf.math.top_k(tf.reshape(ious, (anchor_nums, )), k = 1)
        # 创建掩码, 只有最大值位置为 True, 其他为 False
        max_mask = tf.cast(tf.one_hot(indices, depth = anchor_nums), dtype = tf.bool)
        max_mask = tf.reshape(max_mask, (-1, 1))
        # 将 IoU >= POS_THRES 的也标记成 True, 这样可以增加正样本数量, 再将 max_mask 加入到 pos_mask
        pos_mask = ious >= POS_THRES
        pos_mask = tf.logical_or(max_mask, pos_mask)
        # 与 grater_mask 做 and 是因为当前 gt_box 匹配的 IoU 要大于之前匹配的
        # 才能变更这个 anchor box 的标签, 要不然就是之前的标签更合适
        pos_mask = tf.logical_and(pos_mask, grater_mask)

        # 将 deltas 正样本位置替换成计算好的标签值
        deltas = tf.where(pos_mask, get_delta(gt_box, anchor_boxes), deltas)

        # 当前 gt_box 的整数类别转换成 one-hot
        one_hot = tf.reshape(tf.one_hot(cls_id, depth = categories), (-1, 20))
        # 将 cls_ids 对应位置替换成当前 gt_box 的 one-hot 标签
        cls_ids = tf.where(pos_mask, one_hot, cls_ids)

        # 将正样本位置置信度替换成 1
        confidence = tf.where(pos_mask, 1.0, confidence)

    # 循环完成后, confidence 中只有正样本和忽略样本, 还没有负样本
    # 找出 confidence 所有正样本的位置
    pos_mask = confidence > 0
    # 由 max_ious 定位出所有小于阈值的位置
    neg_mask = max_ious < NEG_THRES
    # 从 neg_mask 中去除 pos_mask 位置
    neg_mask = tf.where(pos_mask, False, neg_mask)
    # 将负样本位置的值替换成 0
    confidence = tf.where(neg_mask, 0.0, confidence)

    # 组合成总的标签信息
    # 现在 label 的格式为 (位置标签, 类别标签, 置信度), shape = (10647 × 25)
    # 如果 reshape 可变成 75 个通道, 只是这样就要分成三个 tensor 了, 没有必要
    label = tf.concat([deltas, cls_ids, confidence], axis = -1)

    # 最后返回 max_ious 是不需要的, 只是为了查看每个 ancor box 与 ground truth 的 IoU
    return label
测试函数
# 测试打标签函数
gts = get_ground_truth(label_data[1], label_data[2], CATEGORIES)
label = get_label(gts, anchor_boxes)
# 找出最后一维值为 1 的行, 也就是正样本
pos_mask = tf.equal(label[:, -1], 1)
pos_targets = tf.boolean_mask(label, pos_mask)
print(pos_targets)
输出结果
tf.Tensor(
[[-0.6466271   0.          0.09909087  0.38566247  1.          0.
   0.          0.          0.          0.          0.          0.
   0.          0.          0.          0.          0.          0.
   0.          0.          0.          0.          0.          0.
   1.        ]
 [-1.0986123   0.2513144   0.08004274  0.38566247  1.          0.
   0.          0.          0.          0.          0.          0.
   0.          0.          0.          0.          0.          0.
   0.          0.          0.          0.          0.          0.
   1.        ]
 [-0.3794896   0.7884574   0.01869218 -0.44055638  1.          0.
   0.          0.          0.          0.          0.          0.
   0.          0.          0.          0.          0.          0.
   0.          0.          0.          0.          0.          0.
   1.        ]
 [-0.6466271   0.12516314  0.01869218 -0.44055638  1.          0.
   0.          0.          0.          0.          0.          0.
   0.          0.          0.          0.          0.          0.
   0.          0.          0.          0.          0.          0.
   1.        ]
 [-0.8622235  -0.18805222  0.         -0.42285687  1.          0.
   0.          0.          0.          0.          0.          0.
   0.          0.          0.          0.          0.          0.
   0.          0.          0.          0.          0.          0.
   1.        ]
 [ 0.06252041 -0.2513144   0.03704124 -0.5146644   1.          0.
   0.          0.          0.          0.          0.          0.
   0.          0.          0.          0.          0.          0.
   0.          0.          0.          0.          0.          0.
   1.        ]], shape=(6, 25), dtype=float32)
找到 6 6 6 个正样本, 将它们画到原图上
# 将找出来的正样本 anchor box 显示到原图, gt_box 已经在前面画过了
indices = tf.where(tf.equal(label[:, -1], 1.0))
for t in indices:
    t = t.numpy()[0]
    box = anchor_boxes[t].numpy()
    print(box)
    cv.rectangle(img_copy, (round(box[0]), round(box[1])), (round(box[2]), round(box[3])),
                 (0, 0, random.randint(128, 256)), 2)

plt.figure("label_box", figsize = (8, 4))
plt.imshow(img_copy[..., : : -1])
plt.show()
[ 44. 203.  92. 237.]
[ 60. 275. 108. 309.]
[333.  60. 386. 147.]
[141.  76. 194. 163.]
[ 29.  92.  82. 179.]
[157. 172. 210. 259.]

五. 代码下载
示例代码可下载 [Jupyter Notebook 示例代码] (还未上传)
上一篇: 保姆级 Keras 实现 YOLO v3 二
下一篇: 保姆级 Keras 实现 YOLO v3 四 (待续…)
本文来自互联网用户投稿,该文观点仅代表作者本人,不代表本站立场。本站仅提供信息存储空间服务,不拥有所有权,不承担相关法律责任。 如若内容造成侵权/违法违规/事实不符,请联系我的编程经验分享网邮箱:veading@qq.com进行投诉反馈,一经查实,立即删除!