[PyTorch][chapter 6][李宏毅深度学习][Logistic Regression]
前言:
? ? ? ? ?logistic回归又称logistic回归分析,是一种广义的线性回归分析模型,常用于数据挖掘,疾病自动诊断,经济预测等领域。 逻辑回归根据给定的自变量数据集来估计事件的发生概率,由于结果是一个概率,因此因变量的范围在 0 和 1 之间。 [3]例如,探讨引发疾病的危险因素,并根据危险因素预测疾病发生的概率等。
? ? ? ? ?训练样本特别小的时候用 Generative ?Model会有较好的效果,大的样本使用Discriminative Model,Discriminative Model里面常用的二分类模型sigmoid?,多分类模型softmax
一 sigmoid?简介(Discriminative Model)
? ? 二分类模型
? ? 1.1? ?模型定义
? ? ? ? ? ?使用了sigmoid 函数作为激活函数
? ? ? ? ? ?
? ? ? ? ? ?
? ? ? ? ? ?输出 (0,1)
? ? 1.2? 损失函数
? ? ? ? ? ?假设有N个二分类样本
? ? ? ? ??
? ? ? ? ? ?
? ? ? ? ? ? 损失函数定义为
? ? ? ? ? ??
? ? ? ? ? ?我们要找到参数w,b使得上面概率最大
? ? ? ? ? ??
? ? ? ? ? ? 根据交叉熵原理:我们对式子取对数。因为是求式子的最大值,可以转换成式子乘以负1,之后求最小值
? ? ? ? ? ??
? ? ? ? ? ??
? ? 1.3 梯度
? ? ? ? ? ?对w的求导分为两部分
? ? ? ? ??
? ? ? ? ? ? ? ? ? ? ? ? ? ? ? ?
? ? ? ? ? ?
? ? ? ? ? ? ? ? ? ? ? ? ? ? ? ? ? ?
? ? ? ? ? 合并起来
? ? ? ? ? ? ? ?
? ? ? ? ? ? ? ? ? ? ?
? ? ? ? ? ? ? ? ? ??
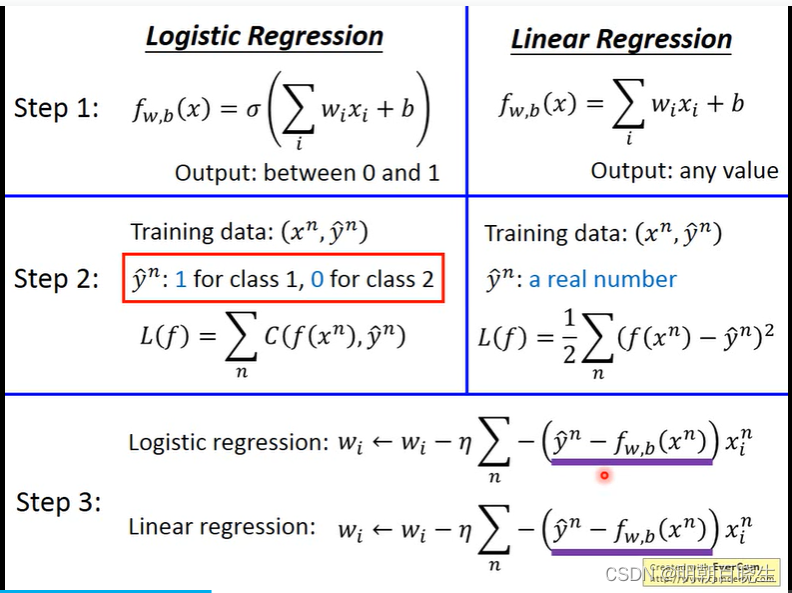
? ? ?1.4 跟Linear 区别
二? Multi-class Classification(softmax)
? ? ? 多分类模型
? ? 2.1? 模型定义
? ? ? ? ? 使用了?softmax 作为激活函数?
? ? ? ? ? ???
?
? 2.2 损失函数
? ? ? ? ? ? 使cross Entropy
? ? ? ? ? ? ?标签是一个one-hot 向量,非零项代表其类别
? ? ? ? ? ??
?
2.3 梯度
? ? ? ?
? ? ? ? ??
? ? ? ? ?
? ? ?损失函数为
? ? ? ?
? ? ? 只跟其中的非零项有关系,假设非零项为
? ? ? ? ??
? ? ? ? ? ?因为标签值是one-hot
? ? ? ? ? ? ?
? ? ? ? ? ? ?所以
? ? ? ? ? ? ??
三 代码
??
任务:
? ? ? ? ?给定的个人资料,预测此人的年收入是否大于50k
数据集说明:
????????????????共有32561训练集数据,16281 测试集数据
(8140 in private test set and 8141 in public test set)数据集情况:共14个feature?
?? ?代表不确定性
1 age 年龄: continuous.
2 workclass 工作性质: Private, Self-emp-not-inc, Self-emp-inc, Federal-gov, Local-gov, State-gov, Without-pay, Never-worked.
3 fnlwgt: continuous. *The number of people the census takers believe that observation represents.人口普查员认为这一观察结果所代表的人数。4 education 教育水平:?
? ?Bachelors, Some-college, 11th, HS-grad, Prof-school, Assoc-acdm, Assoc-voc, 9th, 7th-8th, 12th, Masters, 1st-4th, 10th, Doctorate, 5th-6th, Preschool.5 education-num: continuous.
6 marital-status 婚姻状况:?
? ? Married-civ-spouse, Divorced, Never-married, Separated, Widowed, Married-spouse-absent, Married-AF-spouse.7 occupation 工作:?
? ?Tech-support, Craft-repair, Other-service, Sales, Exec-managerial, Prof-specialty, Handlers-cleaners, Machine-op-inspct, Adm-clerical, Farming-fishing, Transport-moving, Priv-house-serv, Protective-serv, Armed-Forces.8 relationship 关系:?
? ? Wife, Own-child, Husband, Not-in-family, Other-relative, Unmarried.9 race 种族: White, Asian-Pac-Islander, Amer-Indian-Eskimo, Other, Black.
10 sex 性别: Female, Male.
11 capital-gain 资本收益: continuous.
12 capital-loss资本损失: continuous.
13 hours-per-week 每周工作时长: continuous.
14 ?native-country原国际: United-States, Cambodia, England, Puerto-Rico, Canada, Germany, Outlying-US(Guam-USVI-etc), India, Japan, Greece, South, China, Cuba, Iran, Honduras, Philippines, Italy, Poland, Jamaica, Vietnam, Mexico, Portugal, Ireland, France, Dominican-Republic, Laos, Ecuador, Taiwan, Haiti, Columbia, Hungary, Guatemala, Nicaragua, Scotland, Thailand, Yugoslavia, El-Salvador, Trinadad&Tobago, Peru, Hong, Holand-Netherlands.
?针对非数值型的属性,采用了one-hot 编码
分为两个文件:
dataLoader.py: csv文件读取,特征工程
lr.py:? 模型训练??
? ? ? ? ? 其中
? ? ? ? ? ? ? ? ? ?增广矩阵,
? ? ? ? ? ? ? ? ? ?增广矩阵
# -*- coding: utf-8 -*-
"""
Created on Tue Dec 12 14:51:45 2023

@author: chengxf2
"""

import numpy as np
import pandas as pd
from random import shuffle
from math import floor, log


def sample(X, Y):                                 #X and Y are np.array
    randomize = np.arange(X.shape[0])
    np.random.shuffle(randomize)
    return (X[randomize], Y[randomize])


def split_valid_set(X, Y, percentage):
    m = X.shape[0]
    valid_size = int(floor(m * percentage))

    X, Y = sample(X, Y)
    X_valid, Y_valid = X[ : valid_size], Y[ : valid_size]
    X_train, Y_train = X[valid_size:], Y[valid_size:]

    return X_train, Y_train, X_valid, Y_valid

def dataProcess_Y(rawData):

    df_y = rawData['income']
    y = pd.DataFrame((df_y==' >50K').astype("int64"), columns=["income"])
    print('\n y',y.shape)
    return y

def dataProcess_X(rawData):

    #axis=1, 删除列 axis=0 删除 index
    if "income" in rawData.columns:
        Data = rawData.drop(["sex", 'income'], axis=1)
        #(32561, 13)
    else:
        Data = rawData.drop(["sex"], axis=1)

    #读取非数字的column
    listObjectColumn = [col for col in Data.columns if Data[col].dtypes == "object"]
    #数字的column
    listNonObjedtColumn = [x for x in list(Data) if x not in listObjectColumn]


    ObjectData = Data[listObjectColumn]
    NonObjectData = Data[listNonObjedtColumn]

    #insert set into nonobject data with male = 0 and female = 1
    NonObjectData.insert(0 ,"sex", (rawData["sex"] == " Female").astype(int))
    #set every element in object rows as an attribute,相当于one-hot 编码
    ObjectData = pd.get_dummies(ObjectData)

    Data = pd.concat([NonObjectData, ObjectData], axis=1)
    Data_x = Data.astype("int64")
    # Data_y = (rawData["income"] == " <=50K").astype(np.int)
    print("\n data_x: ",Data_x.shape)
    #normalize
    Data_x = (Data_x - Data_x.mean()) / Data_x.std()

    return Data_x


def data_loader():

    trainData =  pd.read_csv("data/train.csv")
    testData =  pd.read_csv("data/test.csv")
    test_label = pd.read_csv("data/correct_answer.csv")

    # here is one more attribute in trainData
    x_train = dataProcess_X(trainData).drop(['native_country_ Holand-Netherlands'], axis=1).values
    x_test = dataProcess_X(testData).values


    y_train = dataProcess_Y(trainData).values
    y_test =  test_label['label'].values

    #x=>x[1,x]
    x_train = np.concatenate((np.ones((x_train.shape[0], 1)), x_train), axis=1)
    x_test = np.concatenate((np.ones((x_test.shape[0], 1)), x_test), axis=1)

    valid_set_percentage = 0.1
    X_train, Y_train, X_valid, Y_valid = split_valid_set(x_train, y_train, valid_set_percentage)

    return X_train, Y_train, X_valid, Y_valid ,x_test,y_test
import numpy as np

from numpy.linalg import inv
import matplotlib.pyplot as plt
from dataLoader import data_loader
from dataLoader import sample
import os
from math import floor, log
import pandas as pd


output_dir = "output/"


def sigmoid(z):
    res = 1 / (1.0 + np.exp(-z))
    return np.clip(res, 1e-8, (1-(1e-8)))


def valid(X, Y, w):
    a = np.dot(w,X.T)
    y = sigmoid(a)
    y_ = np.around(y)
    result = (np.squeeze(Y) == y_)
    print('Valid acc = %f' % (float(result.sum()) / result.shape[0]))
    return y_

def train(X_train, Y_train):

    n= len(X_train[0])
    print("\n n ",n)
    w = np.zeros(n)

    l_rate = 0.001
    batch_size = 32
    m = len(X_train)
    step_num = int(floor(m / batch_size))
    epoch_num = 30
    list_cost = []
    total_loss = 0.0


    for epoch in range(1, epoch_num):
        total_loss = 0.0
        X_train, Y_train = sample(X_train, Y_train)

        for idx in range(1, step_num):
            X = X_train[idx*batch_size:(idx+1)*batch_size]
            Y = Y_train[idx*batch_size:(idx+1)*batch_size]

            s_grad = np.zeros(len(X[0]))


            z = np.dot(X, w)
            y = sigmoid(z)
            #squeeze 即把shape中为1的维度去掉
            loss = y - np.squeeze(Y)
            cross_entropy = -1 * (np.dot(np.squeeze(Y.T), np.log(y)) + np.dot((1 - np.squeeze(Y.T)), np.log(1 - y)))/ len(Y)
            total_loss += cross_entropy

            grad = np.sum( X * (y-np.squeeze(Y)).reshape((batch_size, 1)), axis=0)
            # grad = np.dot(X.T, loss)
            w = w - l_rate * grad

        #print("\n epoch :%d, total_loss: %7.3f"%(epoch, total_loss/batch_size))


        list_cost.append(total_loss)

    # valid(X_valid, Y_valid, w)
    plt.plot(np.arange(len(list_cost)), list_cost)
    plt.title("Train Process")
    plt.xlabel("epoch_num")
    plt.ylabel("Cost Function (Cross Entropy)")
    plt.savefig(os.path.join(os.path.dirname(output_dir), "TrainProcess"))
    plt.show()

    return w

if __name__ == "__main__":

    X_train, Y_train, X_valid, Y_valid,x_test,y_test  = data_loader()
    w_train = train(X_train, Y_train)
    valid(X_valid, Y_valid, w_train)

    print("\n x_test",x_test.shape, "\t y_test ",y_test.shape,"\t w",w_train.shape)

    valid(x_test, y_test, w_train)

    df = pd.DataFrame({"id": np.arange(1, 16282), "label": y_test})
    if not os.path.exists(output_dir):
        os.mkdir(output_dir)
    df.to_csv(os.path.join(output_dir + 'lr_output.csv'), sep='\t', index=False)
https://github.com/maplezzz/ML2017S_Hung-yi-Lee_HW
动手学深度学习——softmax回归(原理解释+代码详解)-CSDN博客
本文来自互联网用户投稿,该文观点仅代表作者本人,不代表本站立场。本站仅提供信息存储空间服务,不拥有所有权,不承担相关法律责任。 如若内容造成侵权/违法违规/事实不符,请联系我的编程经验分享网邮箱:veading@qq.com进行投诉反馈,一经查实,立即删除!