ELK综合案例
2023-12-14 21:46:29
综合案例
ELK+filebeat+nginx+json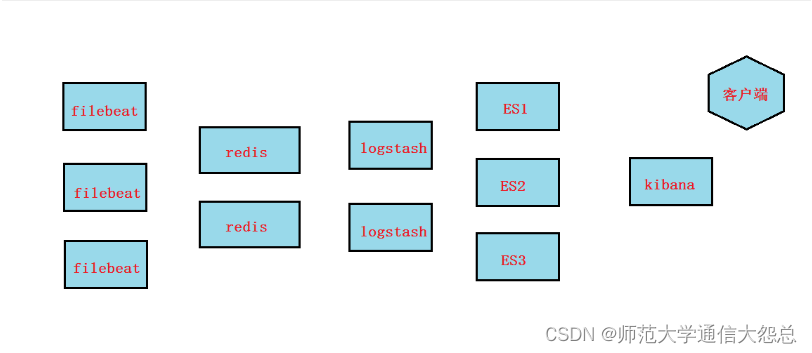
nginx配置
1,在nginx服务器上安装nginx
# yum install epel-release
# yum install nginx
2,将nginx日志改成json格式,这样各个字段就方便最终在kibana进行画图统计了
# vim /etc/nginx/nginx.conf
?
http {
 ? ?log_format ?main ?'$remote_addr - $remote_user [$time_local] "$request" '
 ? ? ? ? ? ? ? ? ? ? ?'$status $body_bytes_sent "$http_referer" '
 ? ? ? ? ? ? ? ? ? ? ?'"$http_user_agent" "$http_x_forwarded_for"';
?
 ? ?log_format json '{ "@timestamp": "$time_iso8601", '
 ? ? ? ? '"remote_addr": "$remote_addr", '
 ? ? ? ? '"remote_user": "$remote_user", '
 ? ? ? ? '"body_bytes_sent": "$body_bytes_sent", '
 ? ? ? ? '"request_time": "$request_time", '
 ? ? ? ? '"status": "$status", '
 ? ? ? ? '"request_uri": "$request_uri", '
 ? ? ? ? '"request_method": "$request_method", '
 ? ? ? ? '"http_referer": "$http_referer", '
 ? ? ? ? '"http_x_forwarded_for": "$http_x_forwarded_for", '
 ? ? ? ? '"http_user_agent": "$http_user_agent"}';
?
 ? ?access_log ?/var/log/nginx/access.log ?json;        把main格式换为json格式
 ? ?
 ? ?
 # systemctl restart nginx
 # systemctl enable nginx
3,使用浏览器或curl或elinks访问nginx.然后查看日志,发现都变成可以转成json格式的格式
# tail -1 /var/log/nginx/access.log
{ "@timestamp": "2019-07-04T17:19:27+08:00", "remote_addr": "10.1.1.1", "remote_user": "-", "body_bytes_sent": "3650", "request_time": "0.000", "status": "404", "request_uri": "/favicon.ico", "request_method": "GET", "http_referer": "-", "http_x_forwarded_for": "-", "http_user_agent": "Mozilla/5.0 (Windows NT 10.0; WOW64) AppleWebKit/537.36 (KHTML, like Gecko) Chrome/55.0.2883.75 Safari/537.36 Maxthon/5.1.5.1000"}
filebeat配置
1,在nginx服务器上安装filebeat安装(filebeat要安装到nginx服务器上收集)
过程省略
2,配置filebeat输出给redis
# cat /etc/filebeat/filebeat.yml | grep -v "#" | grep -v "^$"
filebeat.inputs:
- type: log
 ?enabled: true
 ?paths:
 ? ?- /var/log/nginx/access.log
filebeat.config.modules:
 ?path: ${path.config}/modules.d/*.yml
 ?reload.enabled: false
output.redis:
 ?hosts: ["10.1.1.14"]                                  IP为redis服务器IP
 ?password: "123456"                                    redis的密码
 ?key: "filebeattoredis"
 ?db: 0
 ?datatype: list
processors:
 ?- add_host_metadata: ~
 ?- add_cloud_metadata: ~
?
# systemctl restart filebeat
# systemctl enable filebeat
redis配置
1, 在redis服务器上,安装redis并启动(需要epel源)
# yum install redis -y
?
# vim /etc/redis.conf
61 ?bind 10.1.1.14                      需要filebeat可以连接,或者改为0.0.0.0
?
480 requirepass 123456
?
# systemctl start redis
# systemctl enable redis
# redis-cli -h 10.1.1.14 -a 123456
10.1.1.14:6379> keys *
1) "filebeattoredis"
10.1.1.14:6379> llen filebeattoredis
(integer) 6                          使用浏览器访问nginx,这里就会有相关信息,6表示有6条日志在队列中
logstash配置
1, 在logstash服务器上安装logstash
过程省略
2, 配置logstash,输入为redis,输出给es
# vim /etc/logstash/conf.d/logstash_from_redis.conf
input {
 ?  redis {
 ? ? ?  host => "10.1.1.14"
 ? ? ?  port => 6379
 ? ? ?  password => "123456"
 ? ? ?  db => "0"
 ? ? ?  data_type => "list"
 ? ? ?  key => "filebeattoredis"
 ?  }
}
?
filter {
?
}
?
output {
 ? ? ?  elasticsearch {
 ? ? ? ? ? ?  hosts ?=> ["http://10.1.1.12:9200","http://10.1.1.11:9200"]
 ? ? ? ? ? ?  index ?=> "filebeattoredis-%{+YYYY.MM.dd}"
 ? ? ?  }
 ? ? ?  stdout {
 ? ? ? ?
 ? ? ?  }
}
?
# /usr/share/logstash/bin/logstash --path.settings /etc/logstash -f /etc/logstash/conf.d/logstash_from_redis.conf
3, 在redis服务器上查看
# redis-cli -h 10.1.1.14 -a 123456
10.1.1.14:6379> LLEN filebeattoredis
(integer) 0                          ? 为0了,表示上面6条信息被传到了logstash


# cat /etc/logstash/conf.d/logstash_from_redis.conf
input {
 ? ?redis {
 ? ? ? ?host => "10.1.1.14"
 ? ? ? ?port => 6379
 ? ? ? ?password => "123456"
 ? ? ? ?db => "0"
 ? ? ? ?data_type => "list"
 ? ? ? ?key => "filebeattoredis"
 ? ?}
}
?
filter {
    json {
        source => "message"
    }
?
}
?
output {
 ? ? ? ?elasticsearch {
 ? ? ? ? ? ?hosts ?=> ["http://10.1.1.12:9200","http://10.1.1.11:9200"]
 ? ? ? ? ? ?index ?=> "filebeattoredis-logstashfromredis-%{+YYYY.MM.dd}"
 ? ? ? ?}
 ? ? ? ?stdout {
 ? ? ? ? ? ?
 ? ? ? ?}
}
?
注意:这次使用了json插件,索引名请再修改一个新的
如果要画图的话,请重新创建索引模式来匹配新的索引,才能在图形里找到remote_addr这个字段**
?
# /usr/share/logstash/bin/logstash --path.settings /etc/logstash -f /etc/logstash/conf.d/logstash_from_redis.conf
ELK+filebeat+nginx+grok+geoip
上面的做法还不够高级,下面使用grok插件与geoip插件来实现
1, 停掉前面的logstash进程
-
如果是前台启动,直接ctrl+c即可
-
如果是后台启动, 使用
ps -ef |grep java找出pid,再kill -9 PID
2, 修改nginx日志格式
# vim /etc/nginx/nginx.conf
?
http {
 ? ?log_format ?main ?'$remote_addr - $remote_user [$time_local] "$request" '
 ? ? ? ? ? ? ? ? ? ? ?'$status $body_bytes_sent "$http_referer" '
 ? ? ? ? ? ? ? ? ? ? ?'"$http_user_agent" "$http_x_forwarded_for"';
?
?
 ? ?access_log ?/var/log/nginx/access.log ?main;        改为main格式
?
 # systemctl restart nginx
?
3, 清空日志
# echo > /var/log/nginx/access.log
可以让客户端重新访问几次,确认日志格式正常
4, 配置filebeat并重启
[root@app ~]# cat /etc/filebeat/filebeat.yml
filebeat.inputs:
- type: log
  enabled: true
  paths:
 ?- /var/log/nginx/access.log
  fields:
 ?  app: www
 ?  type: nginx
  fields_under_root: true
?
output.redis:
  hosts: ["10.1.1.14"]
  password: "123456"
  key: "filebeattoredis2"
  db: 0
  datatype: list
 ?
# systemctl restart filebeat
5, 客户端访问nginx, 查看redis是否有队列
# redis-cli -h 10.1.1.14 -a 123456
10.1.1.14:6379> keys *
1) "filebeattoredis2"
10.1.1.14:6379> llen filebeattoredis2
(integer) 2
6, 使用logstash grok插件完成对nginx日志格式化
# vim /etc/logstash/conf.d/logstash_nginx_format.conf
input {
 ? ?redis {
 ? ? ? ?host => "10.1.1.14"
 ? ? ? ?port => 6379
 ? ? ? ?password => "123456"
 ? ? ? ?db => "0"
 ? ? ? ?data_type => "list"
 ? ? ? ?key => "filebeattoredis2"
 ? ?}
}
?
filter {
 ?if [app] == "www" {
 ? ?if [type] == "nginx" {
 ? ? ?grok {
 ? ? ? ?match => {
 ? ? ? ? ?"message" => "%{IPV4:remote_addr} - (%{USERNAME:remote_user}|-) \[%{HTTPDATE:time_local}\] \"%{WORD:request_method} %{URIPATHPARAM:request_uri} HTTP/%{NUMBER:http_protocol}\" %{NUMBER:http_status} %{NUMBER:body_bytes_sent} \"%{GREEDYDATA:http_referer}\" \"%{GREEDYDATA:http_user_agent}\" \"(%{IPV4:http_x_forwarded_for}|-)\""
 ? ? ? ?}
 ? ? ? ?overwrite => ["message"]
 ? ? ?}
 ? ? ?geoip {
 ? ? ? ? ?source => "remote_addr"
 ? ? ? ? ?target => "geoip"
 ? ? ? ? ?database => "/opt/GeoLite2-City.mmdb"
 ? ? ? ? ?add_field => ["[geoip][coordinates]", "%{[geoip][longitude]}"]
 ? ? ? ? ?add_field => ["[geoip][coordinates]", "%{[geoip][latitude]}"]
 ? ? ?}
 ? ? ?date {
 ? ? ? ? ?locale => "en"
 ? ? ? ? ?match => ["time_local", "dd/MMM/yyyy:HH:mm:ss Z"]
 ? ? ?}
 ? ? ?mutate {
 ? ? ? ? ?convert => ["[geoip][coordinates]", "float"]
 ? ? ?}
 ? ?}
 ?}
}
?
output {
 ?elasticsearch {
 ? ? ?hosts ?=> ["http://10.1.1.12:9200","http://10.1.1.11:9200"]
 ? ? ?index ?=> "logstash-nginx-log-format-%{type}-%{+YYYY.MM.dd}"
 ?}
 ?stdout{
 ?}
}
?
?
# /usr/share/logstash/bin/logstash --path.settings /etc/logstash -f /etc/logstash/conf.d/logstash_nginx_format.conf
7, 确认redis队列为0,说明传给了logstash
# redis-cli -h 10.1.1.14 -a 123456
10.1.1.14:6379> keys *
1) "filebeattoredis2"
10.1.1.14:6379> llen filebeattoredis2
(integer) 2
8, 模拟假的客户端访问数据(主要是模拟一些假的公网IP)
可手动在nginx服务器上vim /var/log/nginx/access.log复制粘贴多行,然后改成不同的公网IP
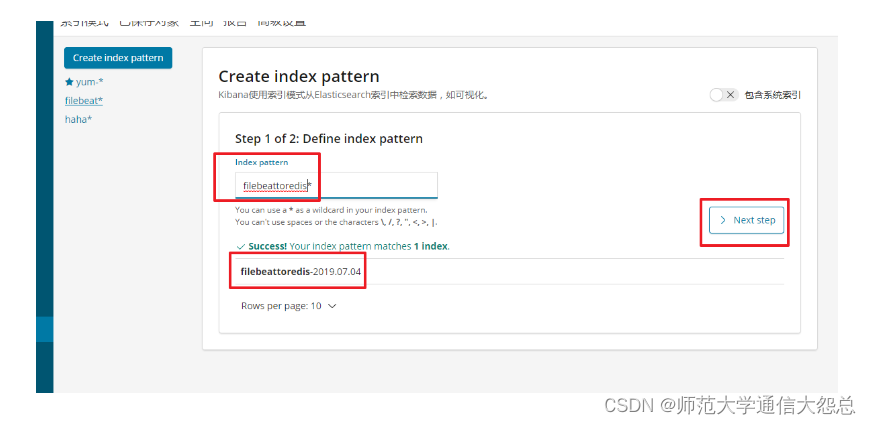
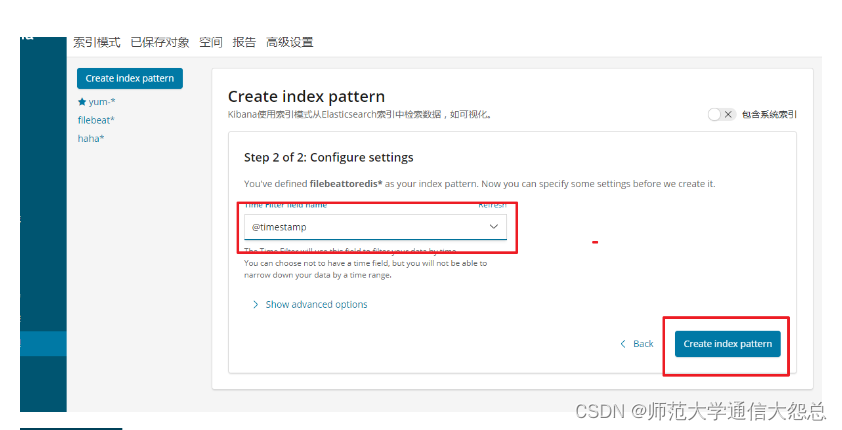
9, 在kibana创建索引模式
过程省略
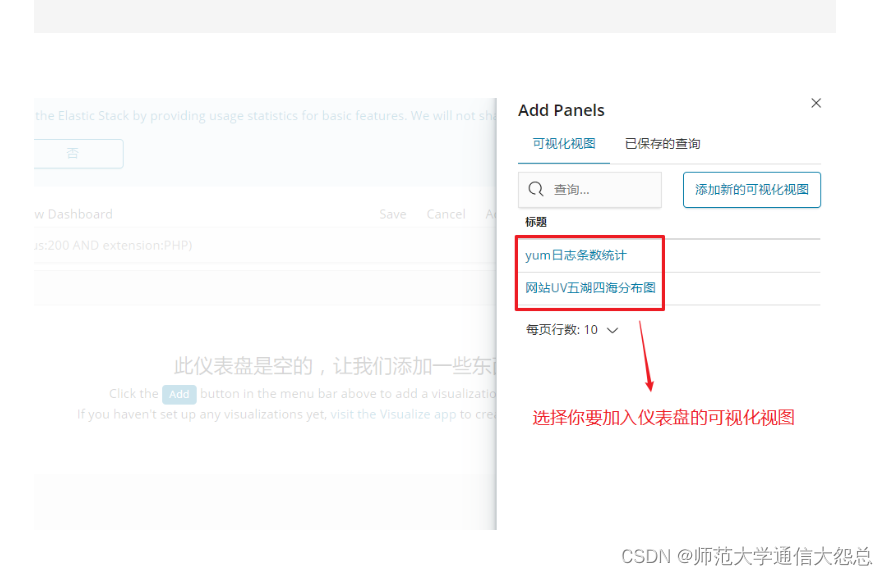
10, 在kibana创建可视化图形
使用unique count用于计算地图区域的客户端IP统计


11, 可选择创建仪表盘,将图形加入仪表盘


文章来源:https://blog.csdn.net/qq_57747969/article/details/134933540
本文来自互联网用户投稿,该文观点仅代表作者本人,不代表本站立场。本站仅提供信息存储空间服务,不拥有所有权,不承担相关法律责任。 如若内容造成侵权/违法违规/事实不符,请联系我的编程经验分享网邮箱:veading@qq.com进行投诉反馈,一经查实,立即删除!
本文来自互联网用户投稿,该文观点仅代表作者本人,不代表本站立场。本站仅提供信息存储空间服务,不拥有所有权,不承担相关法律责任。 如若内容造成侵权/违法违规/事实不符,请联系我的编程经验分享网邮箱:veading@qq.com进行投诉反馈,一经查实,立即删除!