Matlab三维绘图
2024-01-07 17:16:55
绘制三维图plot3
t=0:pi/50:10*pi;
x=sin(t);
y=cos(t);
z=t;
plot3(x,y,z);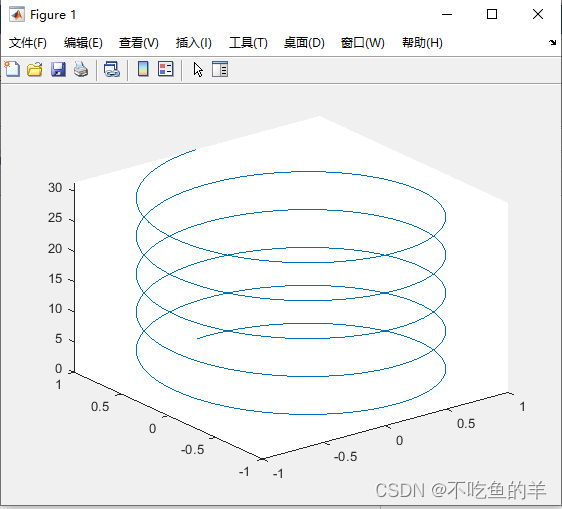
产生栅格数据点meshgrid
这个接口在绘制三维图像里面相当重要,很多时候要将向量变成矩阵才能绘制三维图。
x=0:0.5:5;
y=0:1:10;
[X,Y]=meshgrid(x,y);
plot(X,Y,'o');
x和y是向量,产生出来的X和Y就是矩阵了

画出来的图是这样的

绘制三维网格曲面图mesh
x=-8:0.5:8;
y=x;
[X,Y]=meshgrid(x,y);
R=sqrt(X.^2+Y.^2)+eps;
Z=sin(R)./R;
mesh(X,Y,Z);
可以对比下几个相近的接口使用效果
x=-8:0.5:8;
y=x;
[X,Y]=meshgrid(x,y);
R=sqrt(X.^2+Y.^2)+eps;
Z=sin(R)./R;
subplot(2,2,1);
plot3(X,Y,Z);%只能连成一条一条线,不能做成网格线
subplot(2,2,2);
mesh(X,Y,Z);
subplot(2,2,3);
meshc(X,Y,Z);%在z=0的面上绘制等值线
subplot(2,2,4);
meshz(X,Y,Z);%在图形底部跟外侧添加边框线,感觉就像加了外壁
隐藏线显示和关闭hidden
hidden的使用时机跟hold不同,hold是绘制图形之前就要执行,hidden是绘制图形之后再执行。
hidden on是开启隐藏线功能,可以理解为关闭透视效果,Matlab是正人君子,所以默认是这个。
hidden off是关闭隐藏线功能,可以理解为开启透视效果。
x=-8:0.5:8;
y=x;
[X,Y]=meshgrid(x,y);
R=sqrt(X.^2+Y.^2)+eps;
Z=sin(R)./R;
subplot(2,1,1);
mesh(X,Y,Z);
hidden on;
subplot(2,1,2);
mesh(X,Y,Z);
hidden off;
绘制三维阴影曲面图surf
英文翻译叫阴影,不过我觉得对于中国人应该理解为填充。
shading可以选择颜色分布方式
x=-8:0.5:8;
y=x;
[X,Y]=meshgrid(x,y);
R=sqrt(X.^2+Y.^2)+eps;
Z=sin(R)./R;
subplot(2,2,1);
surf(X,Y,Z);%默认是截面式颜色分布
subplot(2,2,2);
surf(X,Y,Z);
shading faceted;%截面式颜色分布
subplot(2,2,3);
surf(X,Y,Z);
shading interp;%插补式颜色分布
subplot(2,2,4);
surf(X,Y,Z);
shading flat;%平面式颜色分布

还有另外几个类似的接口
x=-8:0.5:8;
y=x;
[X,Y]=meshgrid(x,y);
R=sqrt(X.^2+Y.^2)+eps;
Z=sin(R)./R;
subplot(3,1,1);
surf(X,Y,Z);%默认的阴影曲面图
subplot(3,1,2);
surfc(X,Y,Z);%带等高线阴影曲面图
subplot(3,1,3);
surfl(X,Y,Z);%具有光照效果的阴影曲面图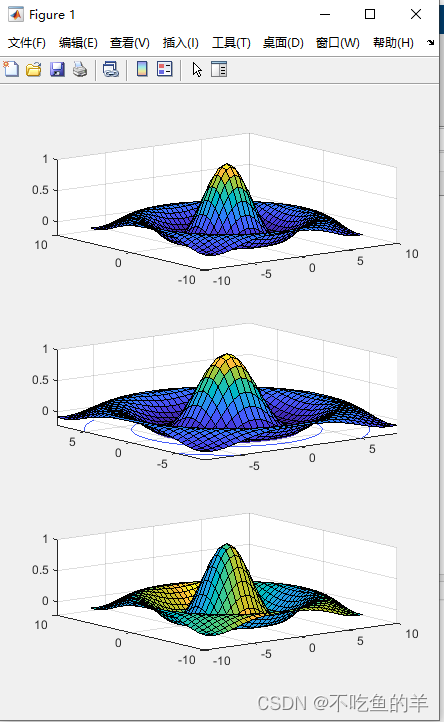
设置视角位置view
得先了解方位角跟仰角指的是哪两个角度,方位角azimuth缩写是az,仰角又叫高度角elevation缩写是el。

subplot(2, 2, 1);
ezmesh(@peaks);%@peaks表示将peaks函数作为输入参数传递给ezmesh接口,ezmesh根据输入的函数绘制三维图
view(3);%3代表默认的三维视角
[a, b]=view;%获取当前视角设置的参数,a是方位角,b是仰角
title(mat2str([a, b]));
subplot(2, 2, 2);
ezmesh(@peaks);
view(2);%默认的二维视角
[a, b]=view;
title(mat2str([a, b]));
subplot(2,2,3);
ezmesh(@peaks);
view([30 45]);%方位角30度,仰角45度
[a, b]=view;
title (mat2str([a, b]));
subplot(2,2,4);
ezmesh(@peaks);
view([1 1 sqrt(2)]);%向量(1,1,sqrt(2))所指方向
[a, b]=view;
title(mat2str([a, b]));
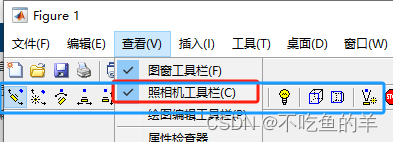
也可以在画图完毕后通过查看->照相机工具栏,里面的工具来设置视角位置。
设置坐标轴axis
跟二维绘图用法一样
subplot(1,3,1);
ezsurf(@(t,s)(sin(t).*cos(s)),@(t,s)(sin(t).*sin(s)),@(t,s)cos(t),[0,2*pi,0,2*pi]);
axis auto;title('auto');
subplot(1,3,2);
ezsurf(@(t,s)(sin(t).*cos(s)),@(t,s)(sin(t).*sin(s)),@(t,s)cos(t),[0,2*pi,0,2*pi]);
axis equal;title('equal');
subplot(1,3,3);
ezsurf(@(t,s)(sin(t).*cos(s)),@(t,s)(sin(t).*sin(s)),@(t,s)cos(t),[0,2*pi,0,2*pi]);
axis square;title('square');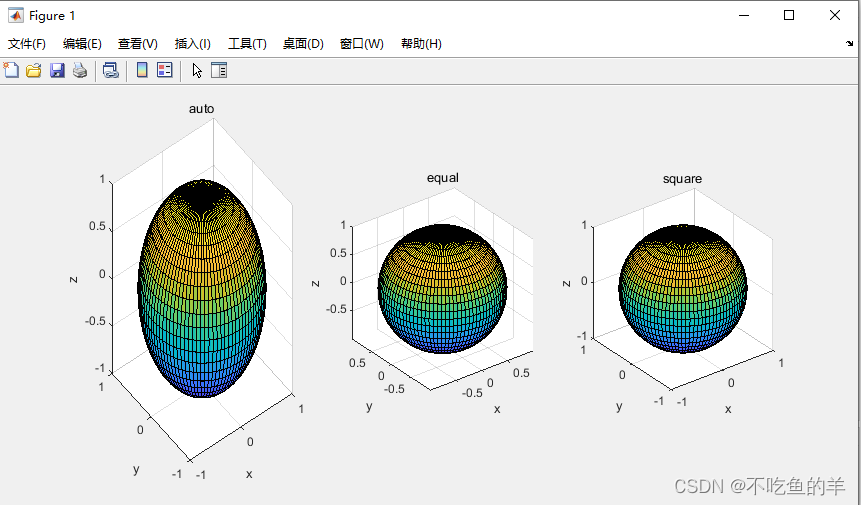
文章来源:https://blog.csdn.net/qiu421/article/details/135423632
本文来自互联网用户投稿,该文观点仅代表作者本人,不代表本站立场。本站仅提供信息存储空间服务,不拥有所有权,不承担相关法律责任。 如若内容造成侵权/违法违规/事实不符,请联系我的编程经验分享网邮箱:veading@qq.com进行投诉反馈,一经查实,立即删除!
本文来自互联网用户投稿,该文观点仅代表作者本人,不代表本站立场。本站仅提供信息存储空间服务,不拥有所有权,不承担相关法律责任。 如若内容造成侵权/违法违规/事实不符,请联系我的编程经验分享网邮箱:veading@qq.com进行投诉反馈,一经查实,立即删除!