【利用二手车数据进行可视化分析】
2023-12-13 23:21:12
利用二手车数据进行可视化分析
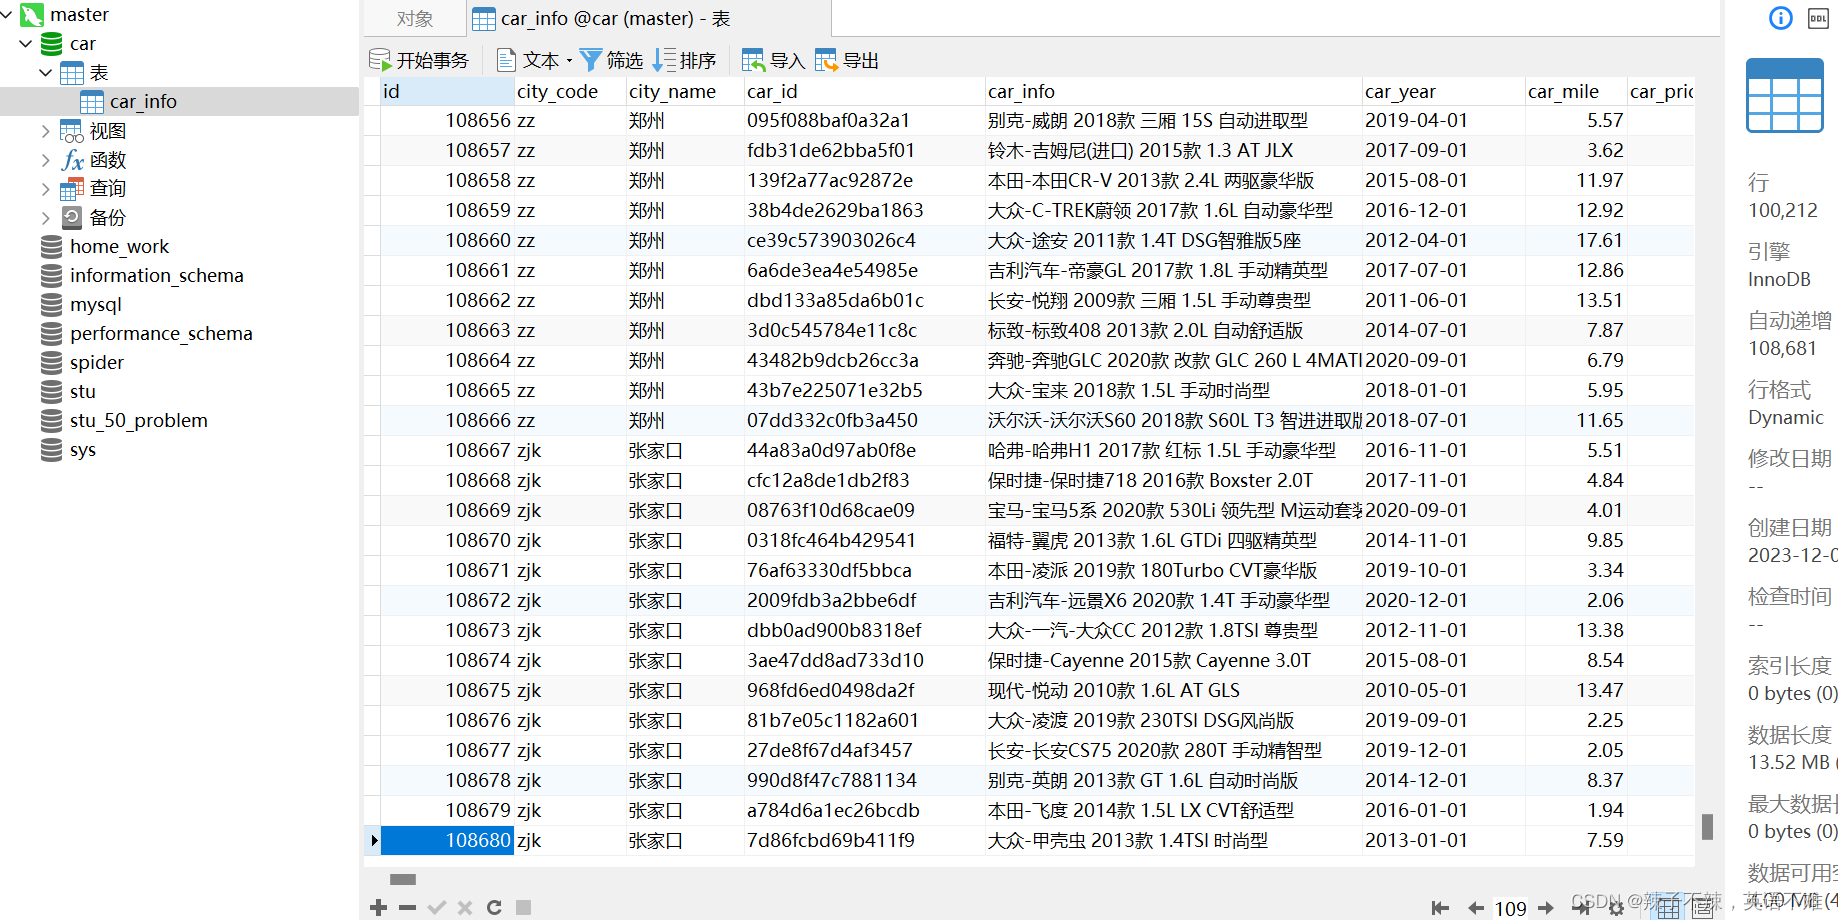
查看原始数据
查看MySQL中爬取完成的数据发现有十万多条,接下来清理一下这些数据看看有没有重复的数据将这些数据剔除

select car_id from car_info group by car_id
可以看到不重复的数据有七万多条,有将近三万条的重复数据,接下来就去除这些重复数据

去除重复数据
先查看一下重复的数据是什么样的
查看一下重复车型的car_id 有好多重复10次以上 复制一些看看这些车的信息
select car_id
       ,count(*) cnt
from car_info
group by car_id
having cnt>2
order by cnt desc

c6a6fa03344447c1
d6d5b6c63184f41c

select * from car_info where car_id = 'c6a6fa03344447c1'


可以看到一些一样的车不止挂在一个地方而是挂在离一个城市周边的地区都会挂牌,导致重复的数据很高,现在我们根据车辆的一些信息分类然后将数据进行清洗。
按照车型,公里数,首付,总价这些车子定量不变的信息进行分类,可以看到清洗出来了8万条数据,这些数据都是不相同的,因为有些车子虽然car_id相等 但是车子的型号等信息不相等。
# 去除重复数据
select car_id
       ,car_info
			 ,car_year
			 ,car_mile
			 ,car_price_total
			 ,car_price_pyment
from car_info
group by car_id,car_info,car_year,car_mile,car_price_total,car_price_pyment

接着将清洗好的数据保存到另一张表下,避免修改源数据,
# 将清洗好的数据保存在另外一张表下 因为使用group分组 所以用max就可以很容易取到city
create table if not exists car_detail as
(select car_id
       ,car_info
			 ,car_year
			 ,car_mile
			 ,car_price_total
			 ,car_price_pyment
			 ,max(city_name) as city
			 ,max(city_code) as city_code
			 ,max(created_at) as creat_time
			 ,max(updated_at) as update_time
from car_info
group by car_id,car_info,car_year,car_mile,car_price_total,car_price_pyment)

需求分析
画图需要使用python绘图或者使用专用软件绘图
使用python绘图可以使用pyecharts
这里我使用软件fineBI绘图
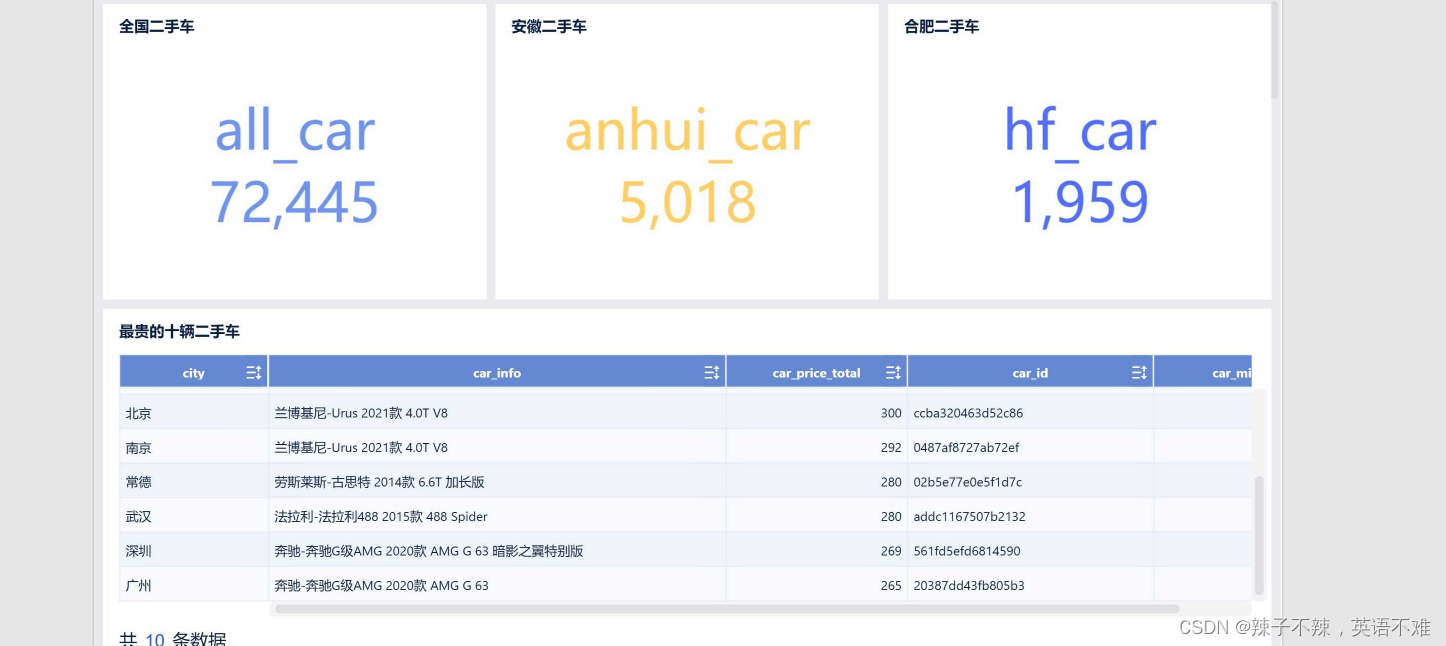
1.统计全国总共有多少量二手车,用KPI图进行展示
create table if not exists ques1 as
(select count(distinct car_id) as all_car
from car_detail)
2.统计安徽总共有多少量二手车,用KPI图进行展示
create table if not exists ques2 as
(select count(distinct car_id) as anhui_car
from car_detail
where city_code in ('hf','wuhu','bengbu','bozhou','hn','mas','huaibei'
,'tongling','anqing',"huangshan",'chuzhou','chizhou','fy','suzhou','la','xuancheng'))
3.统计合肥总共有多少量二手车,用KPI图进行展示
create table if not exists ques3 as
(select count(distinct car_id) as hf_car
from car_detail
where city_code = 'hf')
4.取最贵的10辆二手车信息,用列表图展示
create table if not exists ques4 as
(select city
       ,car_info
			 ,car_id
			 ,car_mile
			 ,car_price_total
from car_detail
order by car_price_total desc
limit 10)
5.各品牌二手车数量,取Top10用饼图展示
create table if not exists ques5 as
(select bend
			 ,count(*) as cont
from
(# SUBSTRING_INDEX(str,delim,count) 类似与split的函数
select SUBSTRING_INDEX(t1.car_info,'-',1) as bend
from car_detail as t1) as tt1
group by bend
order by cont desc
limit 10)
6.各品牌价格最贵的二手车
create table if not exists ques6 as
(select bend
       ,ROUND(max(tt1.car_price_total),2) as max_price
from (select SUBSTRING_INDEX(t1.car_info,'-',1) as bend
       ,t1.car_price_total
from car_detail as t1) as tt1
group by tt1.bend
order by max_price desc)
7.各品牌价格最低的二手车
create table if not exists ques7 as
(select bend
       ,ROUND(min(tt1.car_price_total),2) as min_price
from (select SUBSTRING_INDEX(t1.car_info,'-',1) as bend
       ,t1.car_price_total
from car_detail as t1) as tt1
group by tt1.bend
order by min_price)
8.各城市二手车数量,取Top10用饼图展示
create table if not exists ques8 as
(select city
       ,count(*) as cont
from car_detail
group by city
order by cont desc)
9.几几年款的二手车平均价格走势,取最近10年的数据用折线图展示
create table if not exists ques9 as
(select t1.car_first_year as car_year
			 ,round(avg(t1.car_price_total),2) as price
from
(select year(car_year) as car_first_year
       ,car_price_total
from car_detail) as t1
group by t1.car_first_year
order by car_year desc)
10.统计每座城市二手车数量,并通过地图展示
create table if not exists ques10 as
(select city,
       count(*) as car_number
from car_detail
group by city
order by car_number desc)
利用生成的表在FineBI中绘图
链接数据库

传入数据库中的表


新建分析进行绘图

绘图完成


文章来源:https://blog.csdn.net/qq_50847752/article/details/134912472
本文来自互联网用户投稿,该文观点仅代表作者本人,不代表本站立场。本站仅提供信息存储空间服务,不拥有所有权,不承担相关法律责任。 如若内容造成侵权/违法违规/事实不符,请联系我的编程经验分享网邮箱:veading@qq.com进行投诉反馈,一经查实,立即删除!
本文来自互联网用户投稿,该文观点仅代表作者本人,不代表本站立场。本站仅提供信息存储空间服务,不拥有所有权,不承担相关法律责任。 如若内容造成侵权/违法违规/事实不符,请联系我的编程经验分享网邮箱:veading@qq.com进行投诉反馈,一经查实,立即删除!