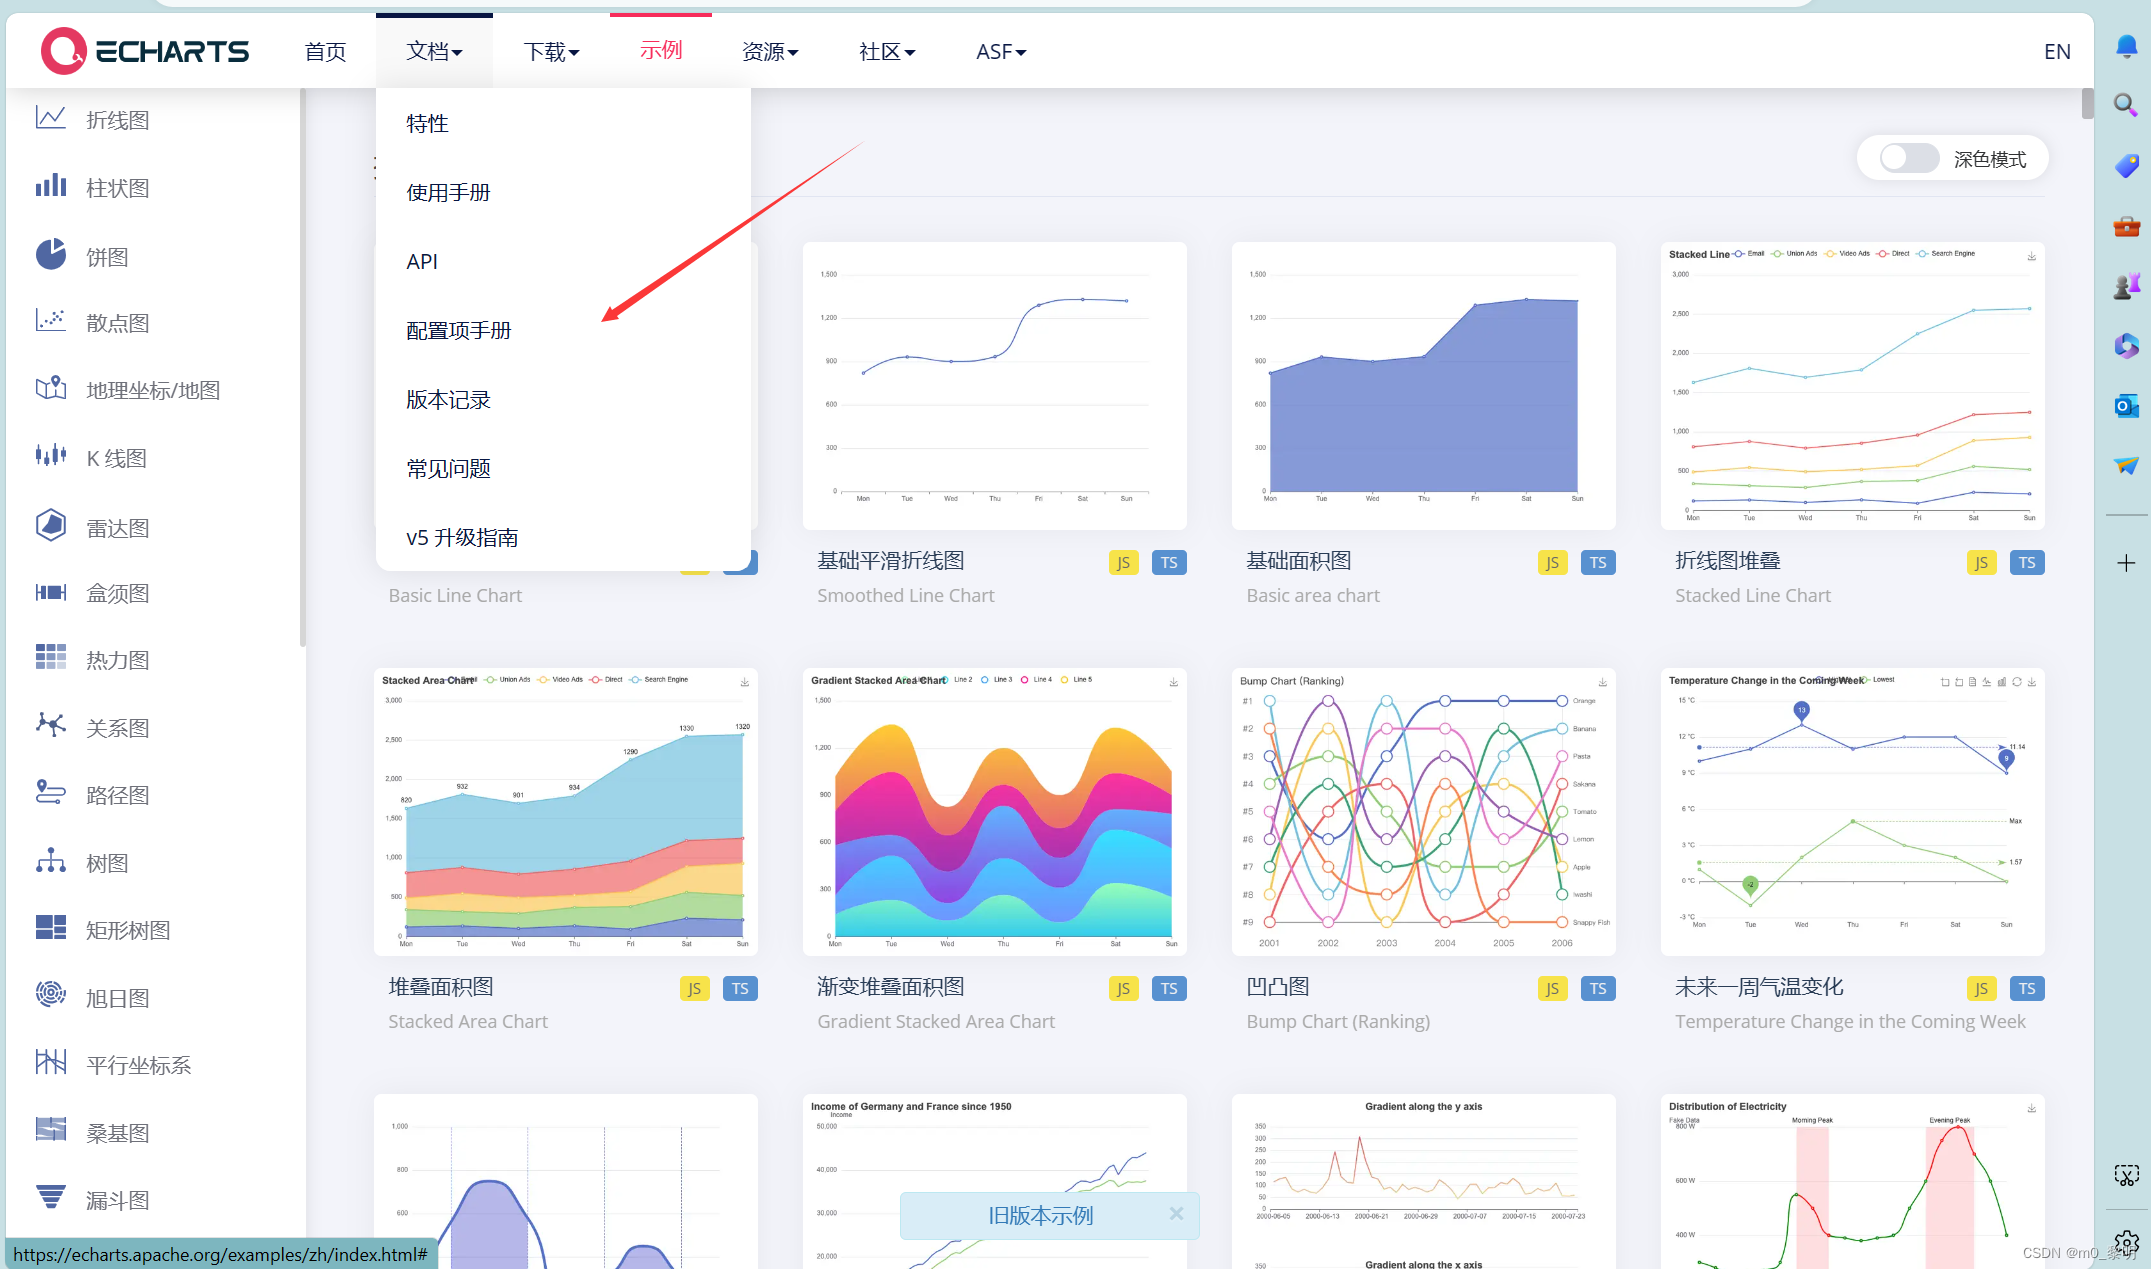
使用vue3实现echarts漏斗图表以及实现echarts全屏放大效果
2023-12-29 06:30:38

?1.首先安装echarts
安装命令:npm install echarts --save
2.页面引入?echarts
import * as echarts from 'echarts';3.代码
<template>
<div id="main" :style="{ width: '400px', height: '500px' }"></div>
</template>
<script setup>
let Chart = echarts.init(document.getElementById('main'));
    // 绘制图表
    let options = {
      title: {
        text: 'Funnel'
      },
      toolbox: {
        feature: {
          restore: { show: true }, // 重置
          myFull: {
            // 全屏
            show: true,
            title: '全屏',
            icon: 'path://M432.45,595.444c0,2.177-4.661,6.82-11.305,6.82c-6.475,0-11.306-4.567-11.306-6.82s4.852-6.812,11.306-6.812C427.841,588.632,432.452,593.191,432.45,595.444L432.45,595.444z M421.155,589.876c-3.009,0-5.448,2.495-5.448,5.572s2.439,5.572,5.448,5.572c3.01,0,5.449-2.495,5.449-5.572C426.604,592.371,424.165,589.876,421.155,589.876L421.155,589.876z M421.146,591.891c-1.916,0-3.47,1.589-3.47,3.549c0,1.959,1.554,3.548,3.47,3.548s3.469-1.589,3.469-3.548C424.614,593.479,423.062,591.891,421.146,591.891L421.146,591.891zM421.146,591.891',
            onclick: (e) => {
              // let fullFlag = true;
              let element = document.getElementById('main');
              // 一些浏览器的兼容性
              if (element.requestFullScreen) {
                // HTML W3C 提议
                element.requestFullScreen();
              } else if (element.msRequestFullscreen) {
                // IE11
                element.msRequestFullScreen();
              } else if (element.webkitRequestFullScreen) {
                // Webkit (works in Safari5.1 and Chrome 15)
                element.webkitRequestFullScreen();
              } else if (element.mozRequestFullScreen) {
                // Firefox (works in nightly)
                element.mozRequestFullScreen();
              }

              // 退出全屏
              if (element.requestFullScreen) {
                document.exitFullscreen();
              } else if (element.msRequestFullScreen) {
                document.msExitFullscreen();
              } else if (element.webkitRequestFullScreen) {
                document.webkitCancelFullScreen();
              } else if (element.mozRequestFullScreen) {
                document.mozCancelFullScreen();
              }
            },
          },
        },
      },
      tooltip: {
        trigger: 'item',
        formatter: '{a} <br/>{b} : {c}%',
      },
      legend: {
        orient: 'vertical',
        left: 'left',
        top: '40',
        bottom: '50',
        data: ['Show', 'Click', 'Visit', 'Inquiry', 'Order']
      },
      series: [
        {
          name: 'Expected',
          type: 'funnel',
          left: '22%',
          top: 80,
          bottom: 100,
          width: '80%',
          min: 0,
          max: 100,
          minSize: '0%',
          maxSize: '100%',
          sort: 'descending',
          gap: 2,
          labelLine: {
            show: false,
          },
          label: {
            show: true,
            position: 'inside',
          },
          data: [],
        },
        {
          name: '订单',
          type: 'funnel',
          left: '20%',
          width: '80%',
          maxSize: '100%',
          label: {
            position: 'inside',
            formatter: '{c}单',
            color: '#fff',
          },
          emphasis: {
            label: {
              position: 'inside',
              formatter: '{b}: {c}单',
            },
          },
          data: [
             { value: 60, name: 'Visit' },
        { value: 40, name: 'Inquiry' },
        { value: 20, name: 'Order' },
        { value: 80, name: 'Click' },
        { value: 100, name: 'Show' }
          ],
        },
      ],
    };
    // 渲染图表
    Chart.setOption(options);
    const onresize = function () {
      //自适应大小
      Chart.resize();
    };
    window.addEventListener('resize', onresize);
</script>
文章来源:https://blog.csdn.net/m0_74265396/article/details/135270128
本文来自互联网用户投稿,该文观点仅代表作者本人,不代表本站立场。本站仅提供信息存储空间服务,不拥有所有权,不承担相关法律责任。 如若内容造成侵权/违法违规/事实不符,请联系我的编程经验分享网邮箱:veading@qq.com进行投诉反馈,一经查实,立即删除!
本文来自互联网用户投稿,该文观点仅代表作者本人,不代表本站立场。本站仅提供信息存储空间服务,不拥有所有权,不承担相关法律责任。 如若内容造成侵权/违法违规/事实不符,请联系我的编程经验分享网邮箱:veading@qq.com进行投诉反馈,一经查实,立即删除!