vue3+echarts可视化——记录我的2023编程之旅
文章目录

?前言
大家好,我是yma16,本文分享关于 vue3+echarts可视化——记录我的2023编程之旅。
数据来源
- 回顾2023,我在gitcode、gitee、github上的提交记录数据
- 回顾2023,我在csdn发布的文章数量
- 回顾2023,我在csdn的粉丝量
- 回顾2023,我的博客社区数量
?2023我在csdn的旅途痕迹
以下是我在csdn留下的痕迹
💖node系列文章
node_windows环境变量配置
node_npm发布包
linux_配置node
node_nvm安装配置
node笔记_http服务搭建(渲染html、json)
node笔记_读文件
node笔记_写文件
node笔记_连接mysql实现crud
node笔记_formidable实现前后端联调的文件上传
node笔记_koa框架介绍
node_koa路由
node_生成目录
node_读写excel
node笔记_读取目录的文件
node笔记——调用免费qq的smtp发送html格式邮箱
node实战——搭建带swagger接口文档的后端koa项目(node后端就业储备知识)
node实战——后端koa结合jwt连接mysql实现权限登录(node后端就业储备知识)
node实战——koa给邮件发送验证码并缓存到redis服务(node后端储备知识)
node实战——koa实现文件下载和图片/pdf/视频预览(node后端储备知识)
💖vue3系列文章
vue3 + fastapi 实现选择目录所有文件自定义上传到服务器
前端vue2、vue3去掉url路由“ # ”号——nginx配置
csdn新星计划vue3+ts+antd赛道——利用inscode搭建vue3(ts)+antd前端模板
认识vite_vue3 初始化项目到打包
python_selenuim获取csdn新星赛道选手所在城市用echarts地图显示
让大模型分析csdn文章质量 —— 提取csdn博客评论在文心一言分析评论区内容
前端vue3——html2canvas给网站截图生成宣传海报
💖python系列文章
python爬虫_基本数据类型
python爬虫_函数的使用
python爬虫_requests的使用
python爬虫_selenuim可视化质量分
python爬虫_django+vue3可视化csdn用户质量分
python爬虫_正则表达式获取天气预报并用echarts折线图显示
python爬虫_requests获取bilibili锻刀村系列的字幕并用分词划分可视化词云图展示
python爬虫_selenuim登录个人markdown博客站点
python爬虫_requests获取小黄人表情保存到文件夹
💖react系列文章
next.js博客搭建_初始化next项目(第一步)
next.js博客搭建_登录注册(第二步)
next.js博客搭建_react-markdown渲染内容(第三步)
💖js拖拽相关文章
前端——html拖拽原理
前端vue3——实现二次元人物拼图校验
💖小程序系列文章
小程序组件传值
小程序自定义微信昵称和头像
小程序制作markdown博客
小程序结合chatgpt制作聊天页面
小程序复制到粘贴板的功能实现
小程序的markdown代码块复制功能
小程序图片二维码识别
小程序获取openid联动django实现
微信小程序_搜索图片功能实现
💖uniapp系列文章
uniapp框架——初始化vue3项目(搭建ai项目第一步)
uniapp框架——vue3+uniFilePicker+fastapi实现文件上传(搭建ai项目第二步)
?可视化布局
关于图表展示的选择
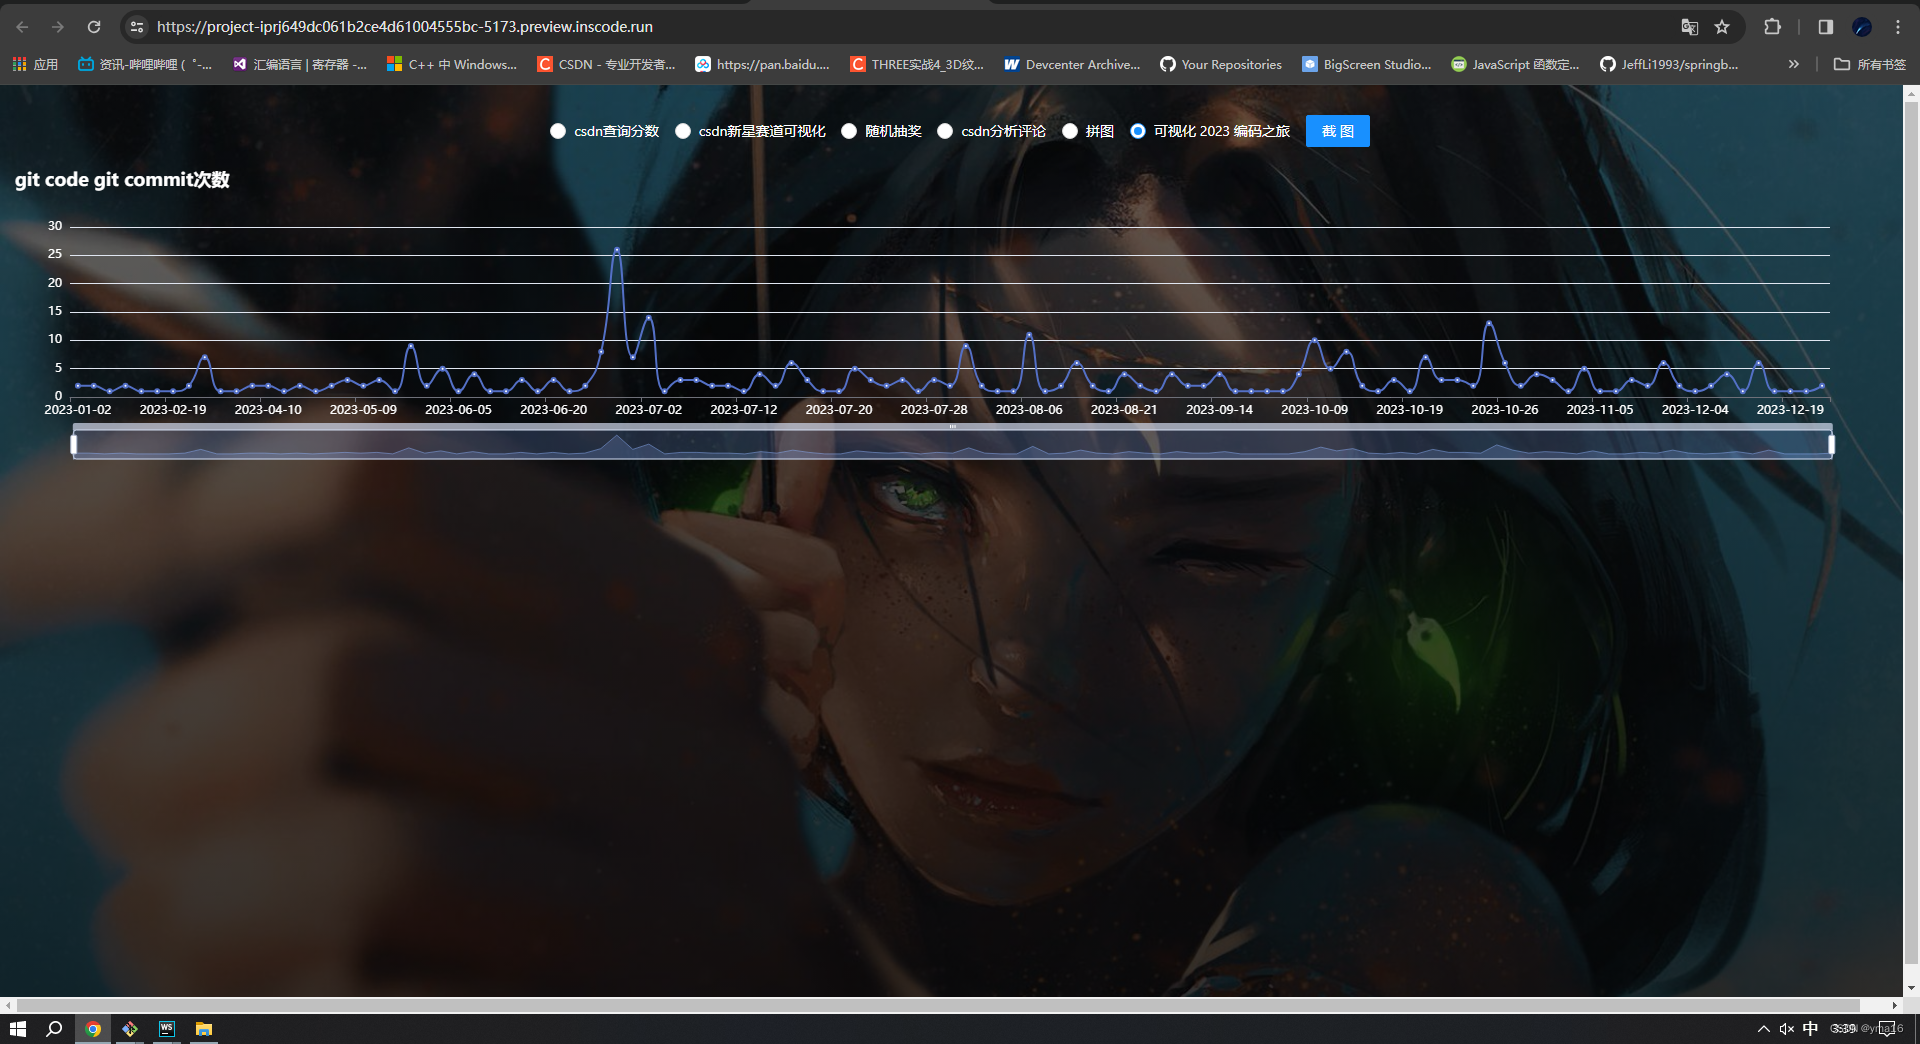
- git代码分布,采用折线图,以时间为维度
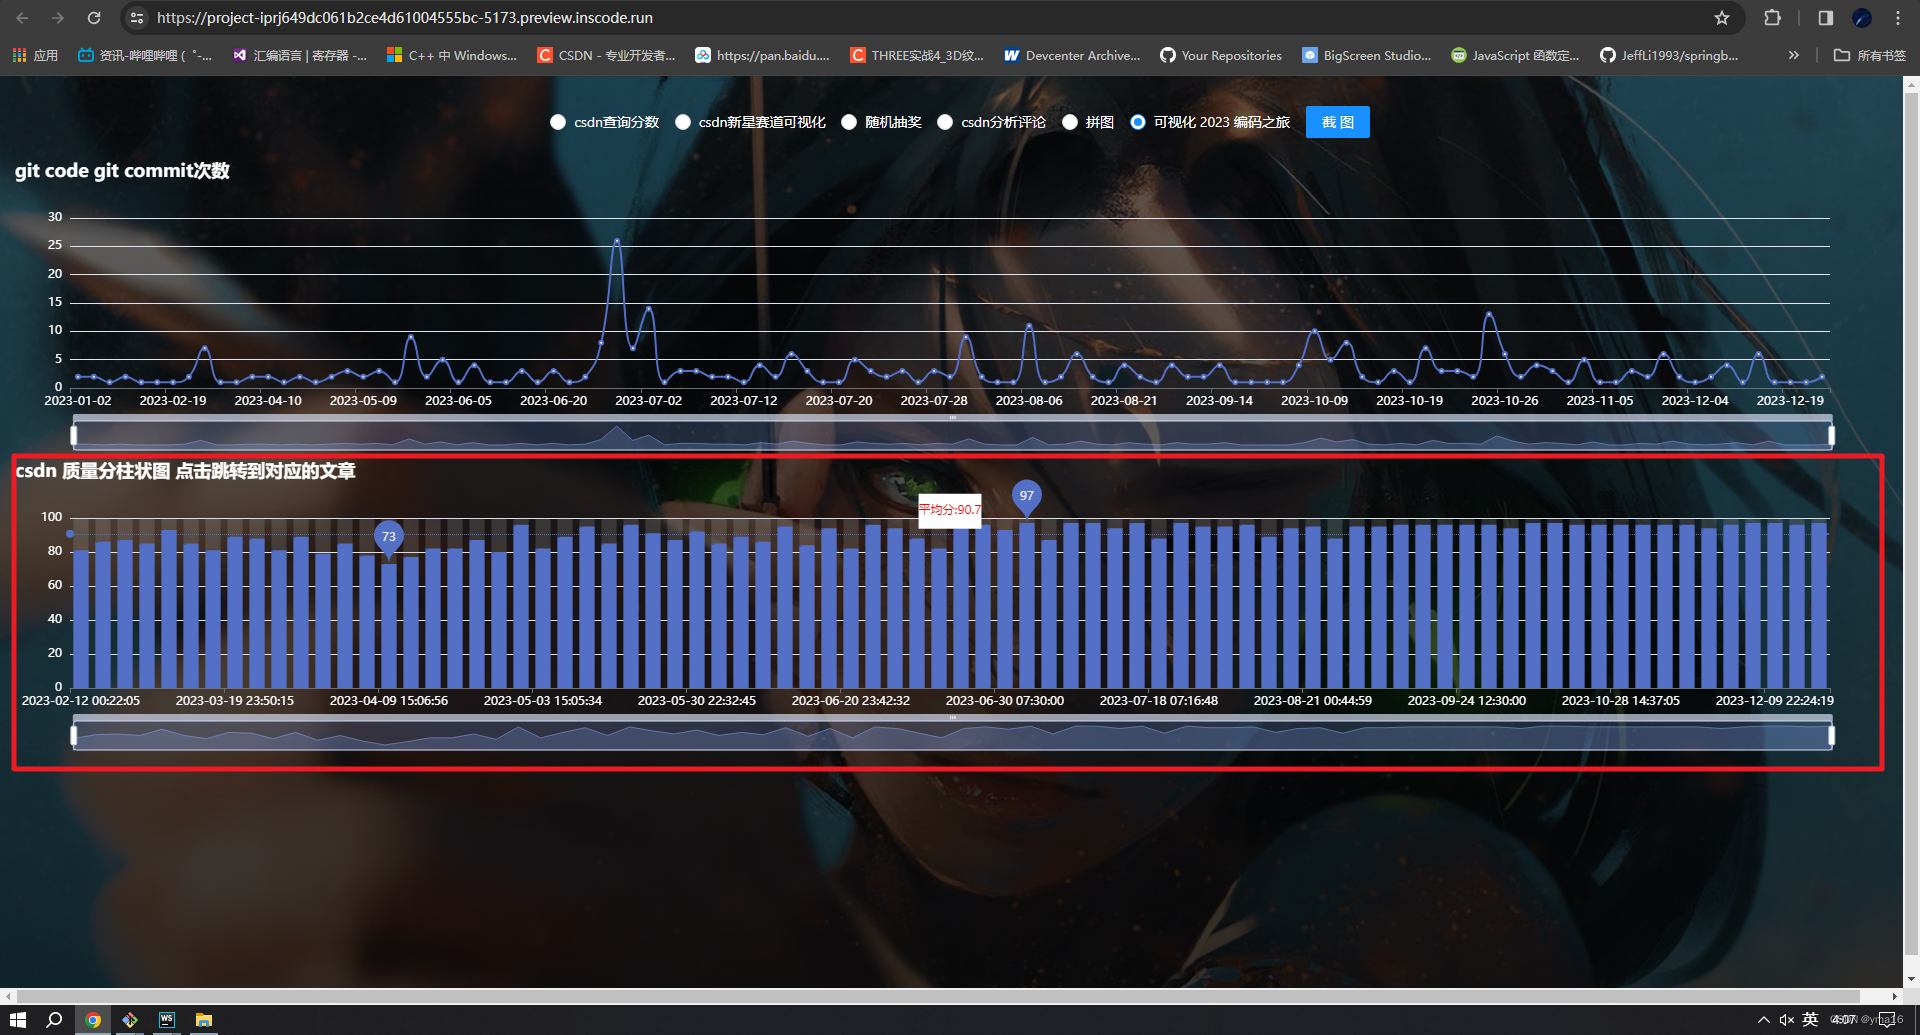
- csdn 发布的文章数量采用 柱状图
- 我在csdn的粉丝数量采用折线图进行分布
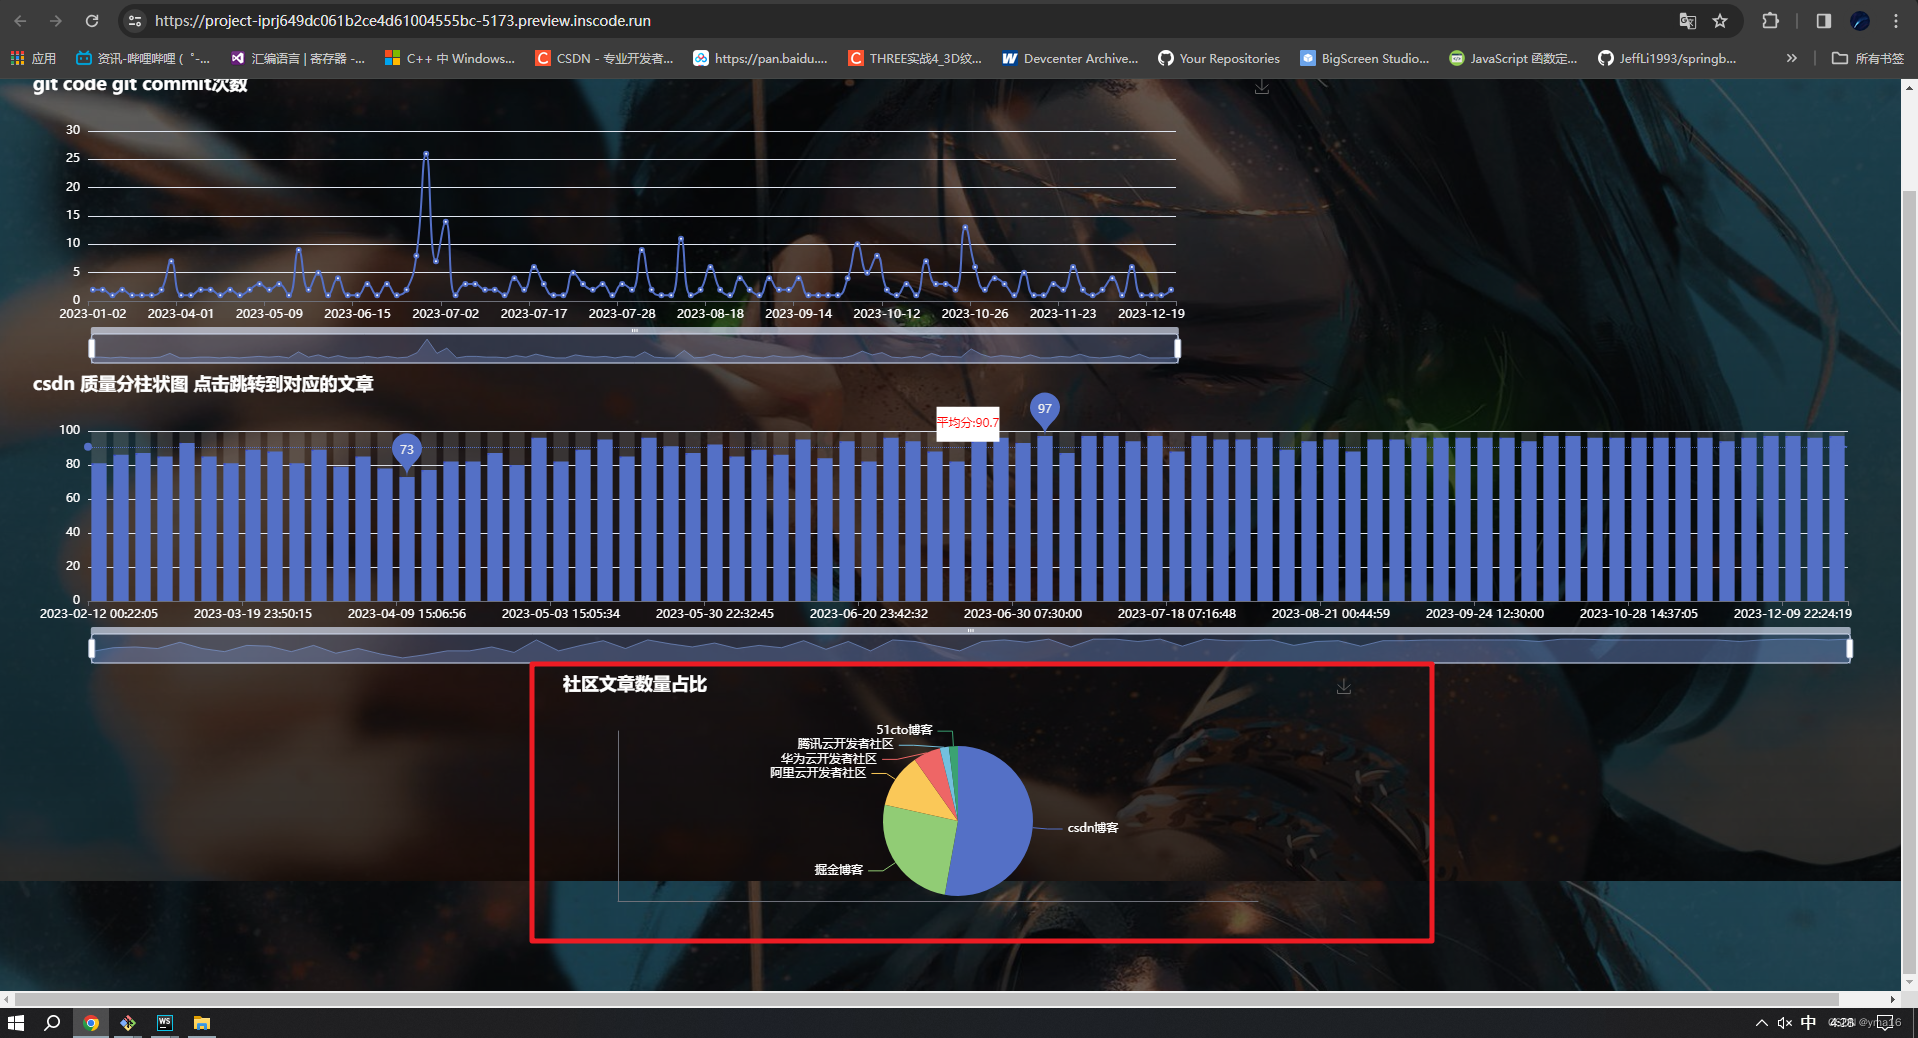
- 社区数量采用饼图进行展示
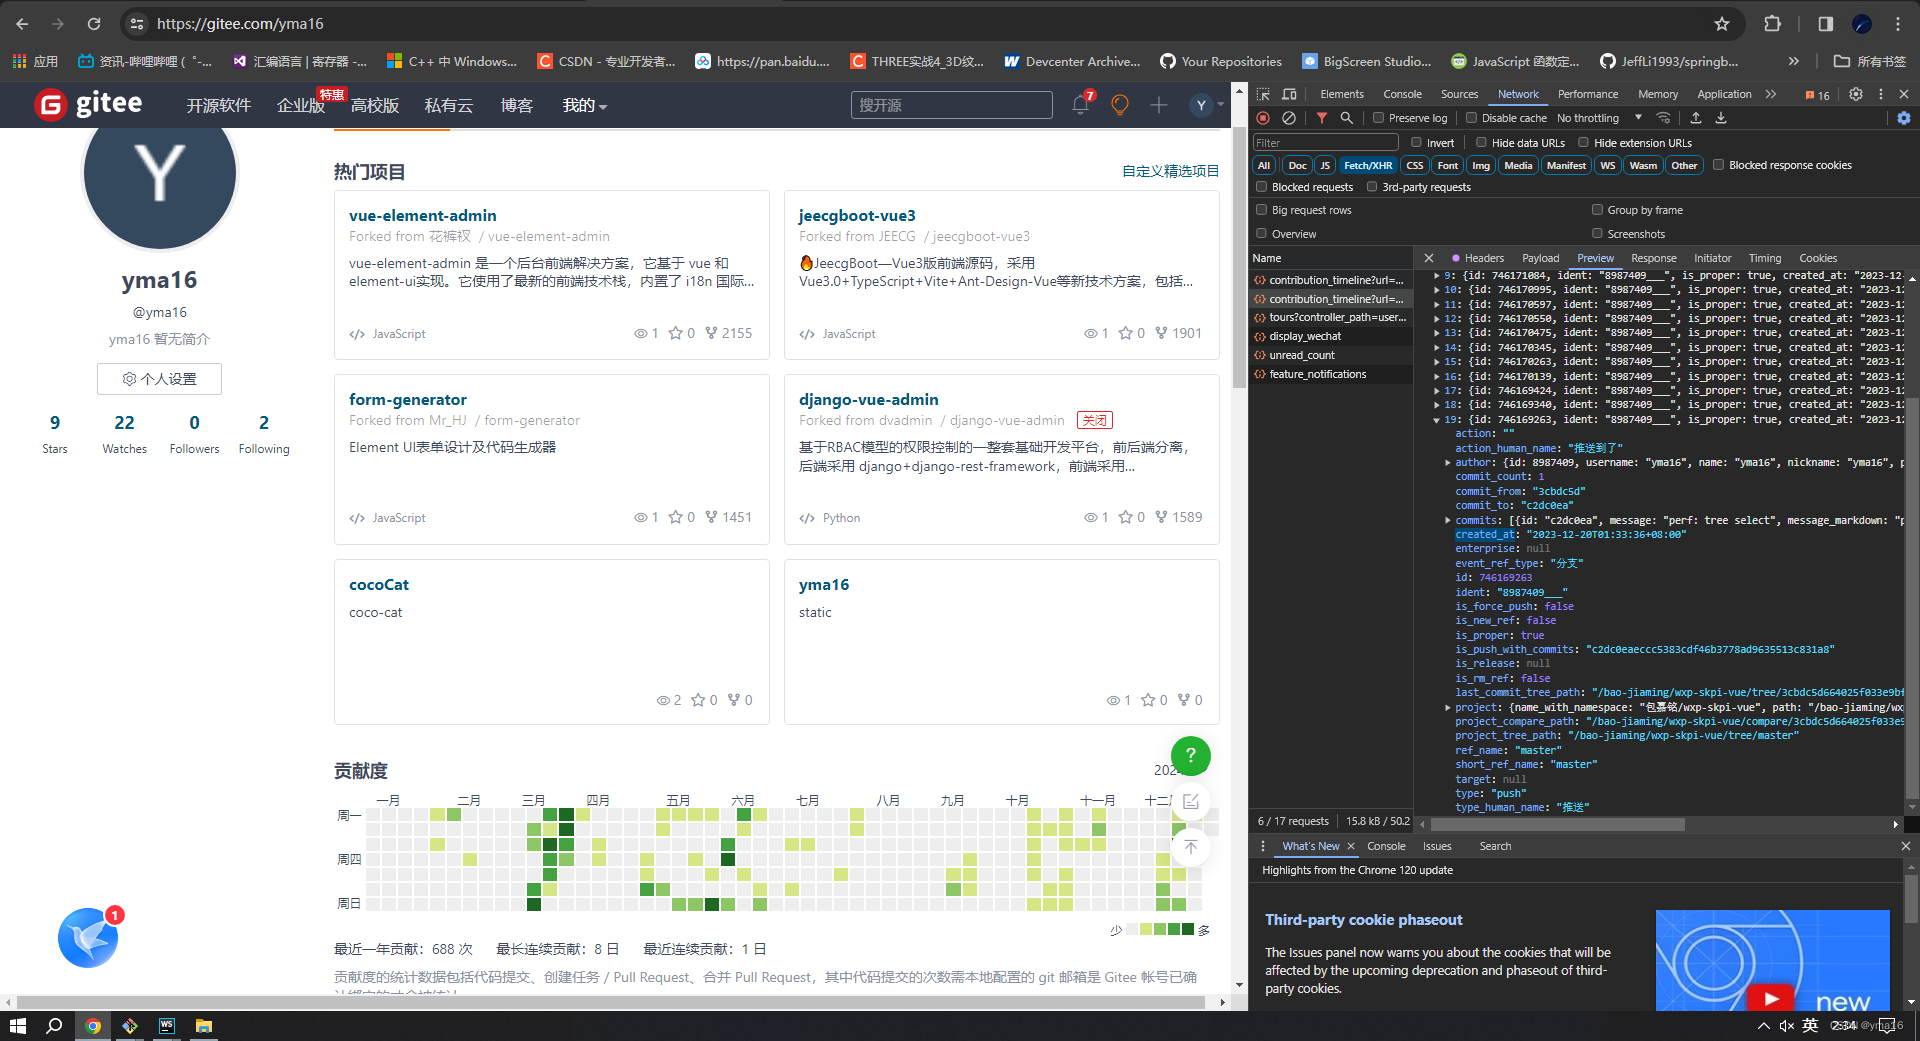
💖 git 数据的提取
gitcode平台提交次数获取 https://gitcode.net/users/qq_38870145/calendar.json
gitcode平台

gitee平台 commit数据获取
?echarts页面
采用上下排版布局样式
💖 vue3 封装 折线图分布 组件
<template>
    <div id="lineChartId" style="width:100vw;height:300px;margin: 0 auto"></div>
</template>
<script setup>
    import * as echarts from 'echarts';
import { defineProps, reactive, watch, nextTick, onUnmounted,onMounted } from 'vue';
import {getCommitData} from './data.js'

const state = reactive({
    exportLoading: false,
    echartInstance: undefined,
    commitConfig:[],
    lineData:[]
})

function renderEchartLine() {
    // 基于准备好的dom,初始化echarts实例
    const domInstance=document.getElementById('lineChartId')
    if(domInstance){
        domInstance.removeAttribute('_echarts_instance_')
    }
    else{
        return
    }
    const myChart = echarts.init(domInstance);
    const seriesItem=    {
      data: state.commitConfig.map(item=>item.count),
      type: 'line',
      smooth: true
    }
    const labelData=state.commitConfig.map(item=>item.date)
    const seriesData=[seriesItem]

    const option = {
        title: {
            text: 'git code git commit次数',
            textStyle:{
                color:'#ffffff'
            }
        },
        toolbox: {
            show: true,
            feature: {
                saveAsImage: {}
            }
        },
        dataZoom: [
            {
                id: 'dataZoomX',
                type: 'slider',
                xAxisIndex: [0],
                filterMode: 'filter'
            }
        ],
        tooltip: {
            trigger: 'axis',
            axisPointer: {
                type: 'shadow'
            }
        },
        legend: {

        },
        xAxis: {
            type: 'category',
            data: labelData,
            axisLabel:{
                color:'#ffffff'
            }
        },
        yAxis: {
            type: 'value',
            axisLabel:{
                color:'#ffffff'
            }
        },
        grid: {
            x: 60,
            x2: 100
        },
        series: seriesData
    };
    // 使用刚指定的配置项和数据显示图表。
    myChart.setOption(option, true);
    // 监听
    state.echartInstance = myChart;
    window.onresize = myChart.resize;
}

onUnmounted(() => {
    window.onresize = null
})
const getCommitConfig= ()=>{
     state.commitConfig=getCommitData()
    renderEchartLine()
}

onMounted(()=>{
    getCommitConfig()
})
</script>
折线图效果如下
💖 vue3 封装 柱状图分布 组件
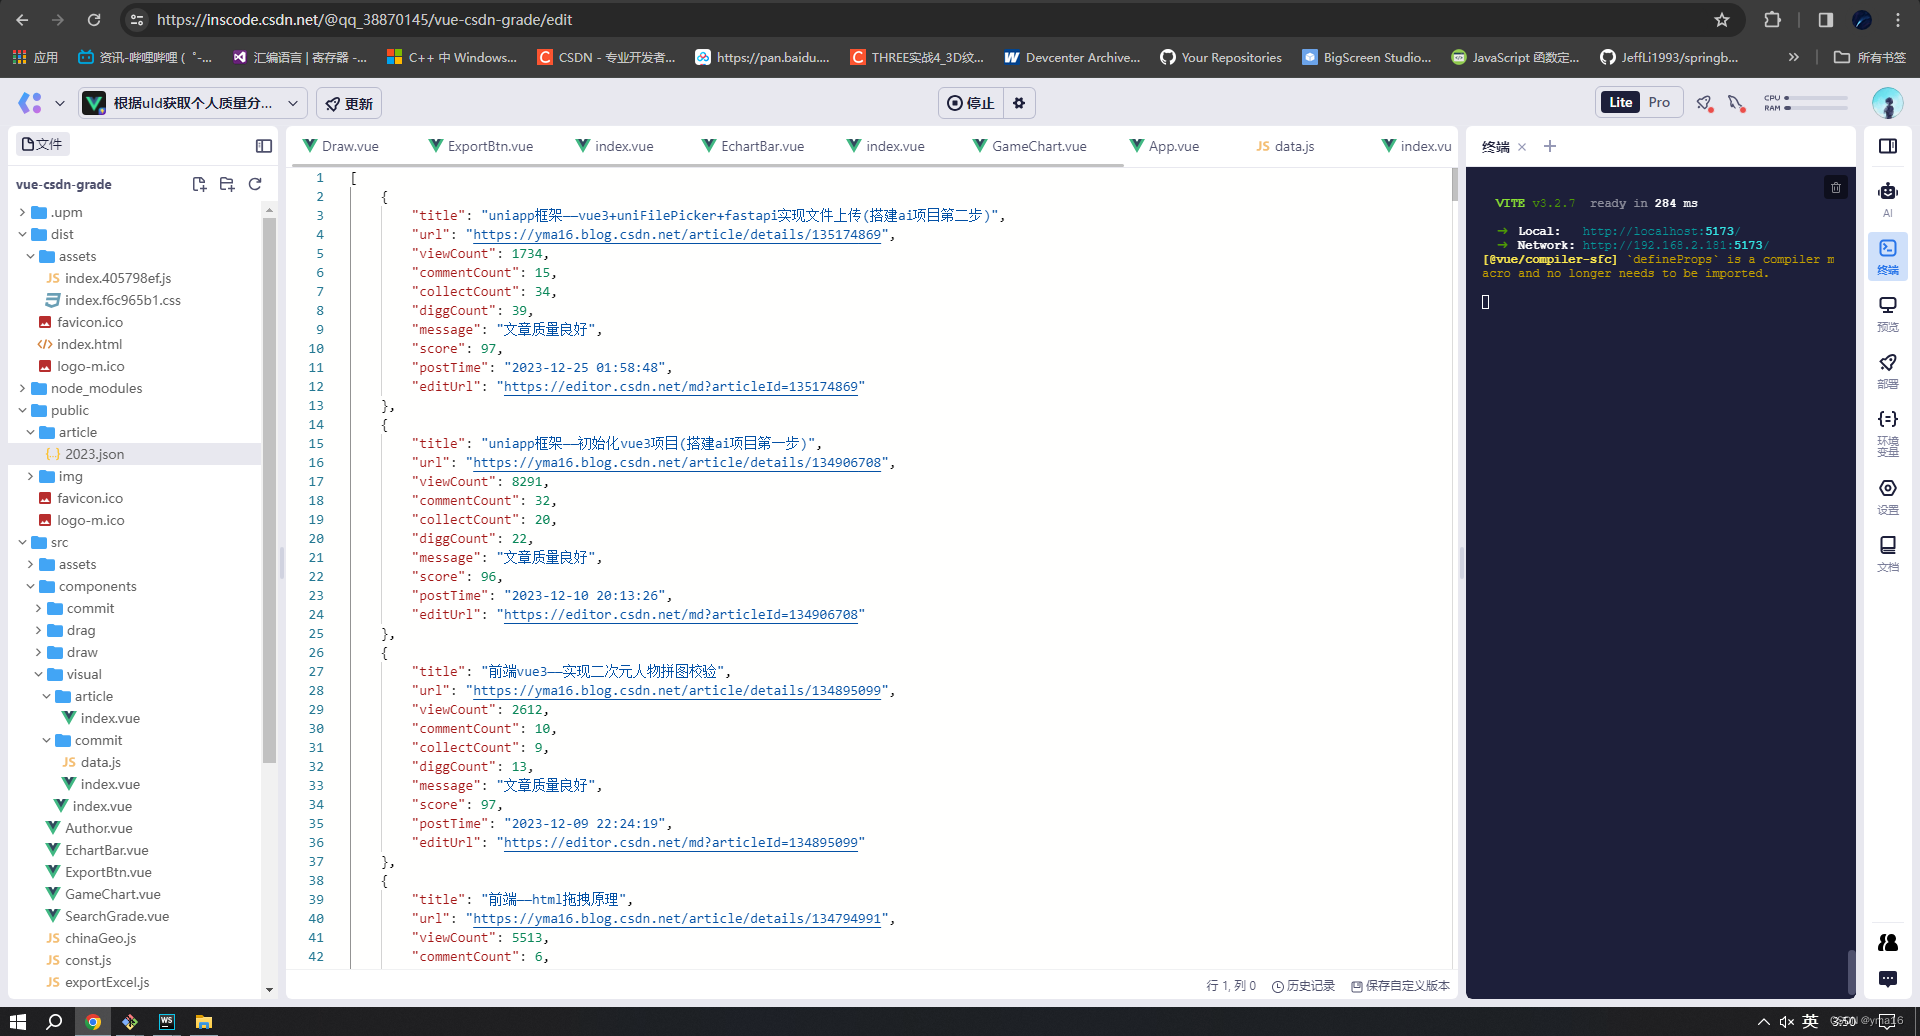
2023 文章质量分 分布 数据
参考我的博客:
python爬虫_django+vue3可视化csdn用户质量分
以下是 过滤的2023 yma16 文章的 所有json数据
代码实现:
<template>
    <div id="barChartId" style="width:100vw;height:900px;margin: 0 auto"></div>
</template>
<script setup>
import * as echarts from 'echarts';
import { defineProps, reactive, watch, nextTick, onUnmounted } from 'vue';
const props = defineProps({
    tableData: []
})

const state = reactive({
    exportLoading: false,
    dataSource: [],
    echartInstance: undefined
})
watch(() => props.tableData,
    (val) => {
        state.dataSource = val
        nextTick(() => {
            renderEchartBar()
        })
    }, {
    deep: true,
    immediate: true
})
function renderEchartBar() {
    // 基于准备好的dom,初始化echarts实例
    const domInstance=document.getElementById('barChartId')
    if(domInstance){
        domInstance.removeAttribute('_echarts_instance_')
    }
    else{
        return
    }
    const myChart = echarts.init(domInstance);
    const option = {
        title: {
            text: 'csdn 质量分柱状图 点击跳转到对应的文章'
        },
        toolbox: {
            show: true,
            feature: {
                saveAsImage: {}
            }
        },
        dataZoom: [
            {
                id: 'dataZoomX',
                type: 'slider',
                xAxisIndex: [0],
                filterMode: 'filter'
            }
        ],
        tooltip: {
            trigger: 'axis',
            axisPointer: {
                type: 'shadow'
            }
        },
        legend: {

        },
        xAxis: {
            type: 'category',
            data: state.dataSource.map(item => item.postTime)
        },
        yAxis: {
            type: 'value'
        },
        grid: {
            x: 60,
            x2: 100
        },
        tooltip: {
            formatter: function (params) {
                let findItem = state.dataSource.find(item => {
                    return item.postTime == params.name
                })
                if (!findItem) {

                    return ''
                }
                return `<span style='color:blue'>-<span> 博客标题:${findItem.title}  <br>
                <span style='color:green'>-<span> 博客质量:${params.value} <br>
                <span style='color:red'>-<span> 博客建议:${findItem.message}<br>
                <span style='color:blue'>-<span> 博客地址:${findItem.url}<br>
                <span style='color:blue'>-<span> 发文时间:${params.name}<br>
               `
            },
        },
        series: [
            {
                data: state.dataSource.map(item => item.score),
                type: 'bar',
                showBackground: true,
                backgroundStyle: {
                    color: 'rgba(180, 180, 180, 0.2)'
                },
                label: { //柱体上显示数值
                    show: true,//开启显示
                    position: 'center',//在上方显示
                    textStyle: {//数值样式
                        fontSize: '2px',
                        color: 'blue'
                    }
                },
                markPoint: {
                    data: [
                        { type: 'max', name: '最高分' },
                        { type: 'min', name: '最低分' }
                    ]
                },
                markLine: {
                    itemStyle: {
                        normal: {
                            lineStyle:
                            {
                                type: 'dotted',
                            },
                            label:
                            {
                                show: true,
                                position: 'middle',
                                color: 'red',
                                lineHeight: 35,
                                backgroundColor: 'rgba(255,255,255.7)',
                                formatter: (params) => {
                                    return params.name + ":" + params.value
                                }
                            }
                        }
                    },
                    data: [
                        {
                            type: 'average',
                            name: '平均分'
                        }]
                }
            }
        ]
    };
    // 使用刚指定的配置项和数据显示图表。
    myChart.setOption(option, true);
    // 监听
    state.echartInstance = myChart;
    myChart.on('click', function (params) {
        const findItem = state.dataSource.find(item => {
            return item.postTime == params.name
        })
        if (params.name) {
            window.open(findItem.url, '_blank')
        }
    });
    window.onresize = myChart.resize;
}

onUnmounted(() => {
    window.onresize = null
})
</script>
csdn 质量分柱状图效果
💖 vue3 封装 饼图分布 组件
yma16社区文章数量:
export const pieData= [
        { value: 270, name: 'csdn博客' },
        { value: 131, name: '掘金博客' },
        { value: 60, name: '阿里云开发者社区' },
        { value: 30, name: '华为云开发者社区' },
        { value: 10, name: '腾讯云开发者社区' },
        { value: 10, name: '51cto博客' },
      ]
饼图分布代码实现
<template>
    <div id="pieChartId" style="width:800px;height:300px;margin: 0 auto"></div>
</template>
<script setup>
    import * as echarts from 'echarts';
import { defineProps, reactive, watch, nextTick, onUnmounted,onMounted } from 'vue';
import {pieData} from './data.js'

const state = reactive({
    exportLoading: false,
    echartInstance: undefined,
    hubData:[],
})

function renderEchartLine() {
    // 基于准备好的dom,初始化echarts实例
    const domInstance=document.getElementById('pieChartId')
    if(domInstance){
        domInstance.removeAttribute('_echarts_instance_')
    }
    else{
        return
    }
    const myChart = echarts.init(domInstance);
    const seriesItem= {
      name: 'Access From',
      type: 'pie',
      radius: '50%',
      data:state.hubData,
      label:{
        color:'#ffffff'
      },
      emphasis: {
        itemStyle: {
          shadowBlur: 10,
          shadowOffsetX: 0,
          shadowColor: 'rgba(0, 0, 0, 0.5)'
        }
      }
    }
    const seriesData=[seriesItem]

    const option = {
        title: {
            text: '社区文章数量占比',
            textStyle:{
                color:'#ffffff'
            }
        },
        toolbox: {
            show: true,
            feature: {
                saveAsImage: {}
            }
        },
        tooltip: {
            trigger: 'axis',
        },
        xAxis: {
            axisLabel:{
                color:'#ffffff'
            }
        },
        yAxis: {
            axisLabel:{
                color:'#ffffff'
            }
        },
        grid: {
            x: 60,
            x2: 100
        },
        series: seriesData
    };
    // 使用刚指定的配置项和数据显示图表。
    myChart.setOption(option, true);
    // 监听
    state.echartInstance = myChart;
    window.onresize = myChart.resize;
}

onUnmounted(() => {
    window.onresize = null
})
const getHubConfig= ()=>{
     state.hubData=[...pieData]
    renderEchartLine()
}

onMounted(()=>{
    getHubConfig()
})
</script>
饼图效果
💖inscode代码块
?总结
前端截图

以上是我2023的可视化数据
可视化分析
可视化分析是通过图表、图形、地图等可视化的方式呈现数据和信息的分析方法。相比传统的数据分析方法,可视化分析具有以下优势:
-
更直观:可视化分析使用图表和图形展示数据,使数据变得更加直观和易于理解。通过可视化,人们可以快速地看到数据中的模式、趋势和关联,而不需要深入研究数据背后的复杂性。
-
更易于发现洞察力:可视化分析有助于发现隐藏在数据中的洞察力和新的信息。通过对数据进行可视化呈现,人们可以更容易地发现异常值、趋势、相关性和模式,从而提供新的洞察力和决策支持。
-
更高效的决策:可视化分析可以帮助人们更快速地做出决策。通过可视化呈现数据,人们可以更快地获取重要信息,了解业务情况,并基于这些信息做出决策。与传统的数据分析方法相比,可视化分析更加直观和高效。
-
更好的沟通和共享:可视化分析能够帮助人们更好地沟通和共享数据和信息。通过可视化呈现数据,人们可以更好地向他人解释数据和分析结果,并确保大家对数据的理解是一致的。同时,可视化结果可以很容易地与他人共享,并且可以轻松地被他人理解和使用。
-
更灵活的探索:可视化分析提供了一种灵活的数据探索方式。通过可视化工具,人们可以根据需要自由地探索数据,并以不同的角度和维度查看和分析数据。这种灵活性可以帮助人们发现潜在的模式和关联,且能够更好地理解数据背后的故事。
💖 2024 展望
2024年的计划我分为以下几点:
- 热爱生活,开始健身
- 拥抱web3.0和gpt
- 追自己的梦,放平心态
- 坚持副业
- stay hungry stay foolish
?结束
本文分享到这结束,如有错误或者不足之处欢迎指出!

👍 点赞,是我创作的动力!
?? 收藏,是我努力的方向!
?? 评论,是我进步的财富!
💖 最后,感谢你的阅读!
本文来自互联网用户投稿,该文观点仅代表作者本人,不代表本站立场。本站仅提供信息存储空间服务,不拥有所有权,不承担相关法律责任。 如若内容造成侵权/违法违规/事实不符,请联系我的编程经验分享网邮箱:veading@qq.com进行投诉反馈,一经查实,立即删除!
