【OpenLayers-1】添加地图
坐标系:
目前OpenLayers3支持两种投影,一个是EPSG:4326,等同于WGS84坐标系;另一个是EPSG:3857,经常用于web地图。一个是全球通用的,一个是web地图专用的。在使用过程中,需要注意OpenLayers3默认使用的是EPSG:3857。
EPSG4326是基于WGS84椭球的经纬度坐标系(大地坐标系,BL)。
EPSG3857是基于球体的、web墨卡托投影(伪墨卡托投影Pseudo-Mercator)的投影坐标系,范围为纬度85度以下,由于google地图最先使用而成为事实标准。至今,大多互联网地图都使用EPSG3857,主要是因为该投影是等角投影,适合地图定向及导航,但是纬度越高,面积变形越大。
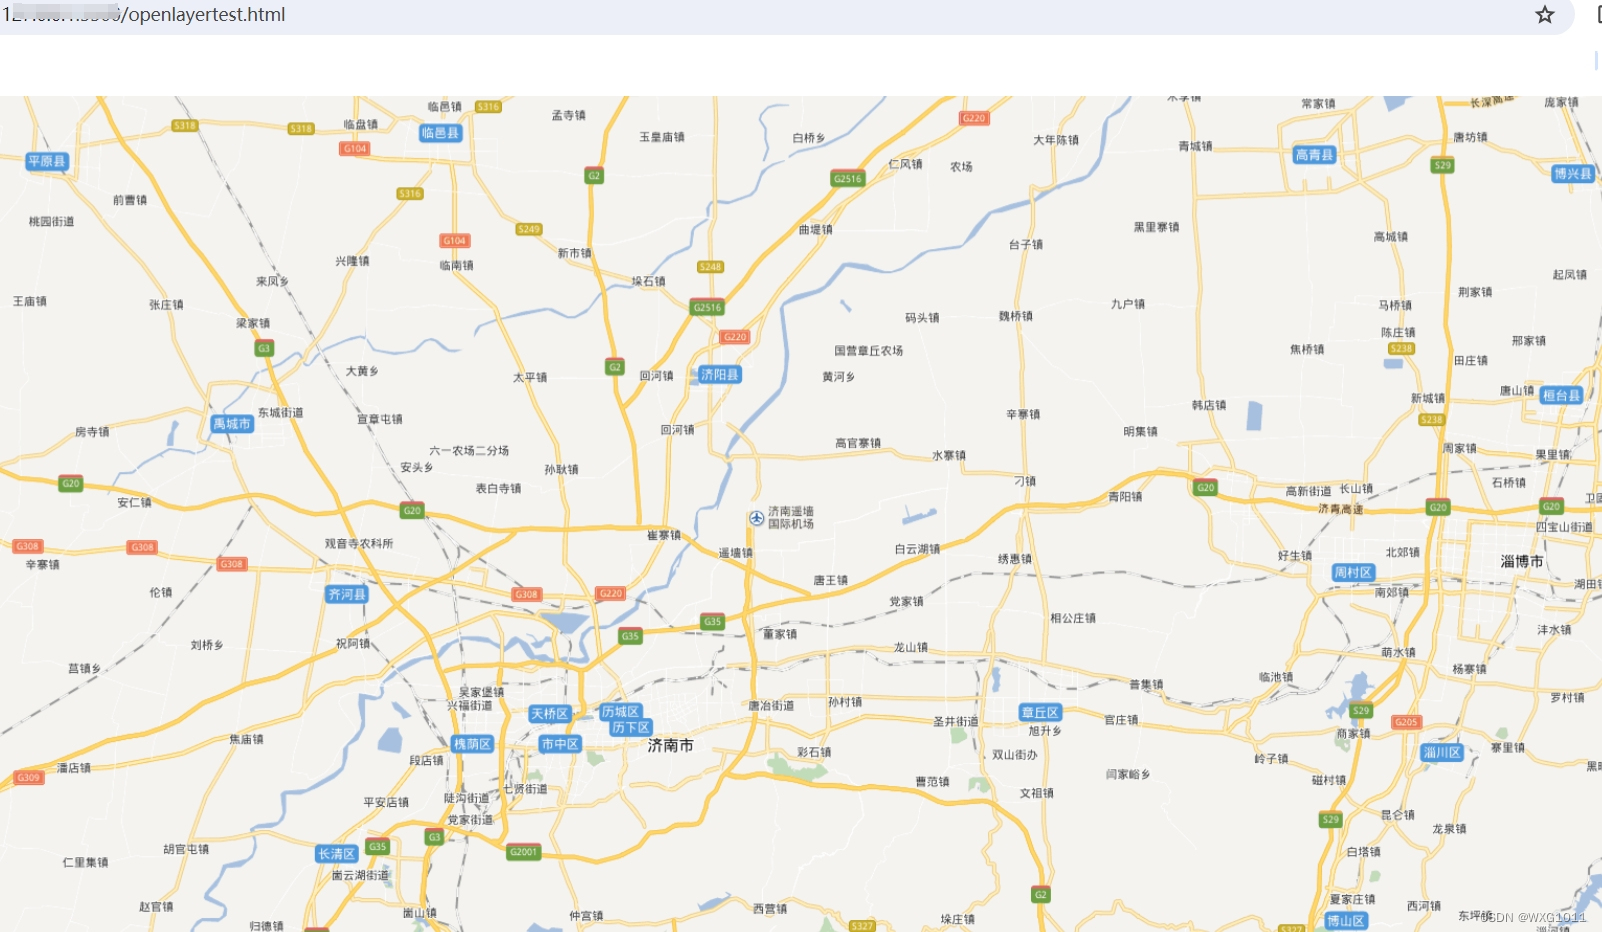
1、添加ArcGIS地图
<!DOCTYPE HTML
  PUBLIC "-//W3C//DTD XHTML 1.0 Transitional//EN" "http://www.w3.org/TR/xhtml1/DTD/xhtml1-transitional.dtd">
<html xmlns="http://www.w3.org/1999/xhtml">

<head>
  <title>坐标添加点</title>
  <script src="https://cdn.jsdelivr.net/npm/ol@v8.2.0/dist/ol.js"></script>
  <link rel="stylesheet" href="https://cdn.jsdelivr.net/npm/ol@v8.2.0/ol.css">
</head>

<body>
  <div id="mapCon" style="width: 100%; height: 100%; position: absolute;">
  </div>
  <script type="text/javascript">
    var url = 'https://map.geoq.cn/ArcGIS/rest/services/ChinaOnlineCommunity/MapServer/tile/{z}/{y}/{x}';
    var map = new ol.Map({
      // 设置地图图层
      layers: [
        new ol.layer.Tile({ source: new ol.source.XYZ({ url: url }) })
      ],
      // 设置显示地图的视图
      view: new ol.View({
        center: [117.23, 36.43],
        zoom: 10,
        projection: 'EPSG:4326'//设置坐标系,地图本身3857坐标系,即横轴墨卡托投影,因为中心点用的度,所以设置成wgs84代号是4326
      }),
      // 让id为map的div作为地图的容器
      target: 'mapCon',
    });
  </script>
</body>

</html>
可以使用网络或者本地两种方式调用OpenLayers。
(1)网络方式调用,在openlayers官网中找到层叠样式表css和openlayers的js API网络路径:
<link stylesheet"href="https://openlayers.org/en/v5.3.0/css/ol.css" type="text/css">
<script src="https://openlayers.org/en/v5.3.0/build/ol.js"></script>
(2)本地方式调用,将路径指向下载到本地的css和js:
假如将文件解压到了F盘,路径指向为:
<link href="E:\v5.3.0\v5.3.0\css\ol.css" rel="stylesheet" type="text/css"/>
<script src="E:\v5.3.0\v5.3.0\build\ol.js" type="text/javascript" ></script>
注:也可以将OpenLayers的css和js文件下载下来,然后使用tomcat、apache等web工具发布成服务,采用网络服务的方式引用
2、添加百度地图
// 自定义分辨率和瓦片坐标系
var resolutions = [];
var maxZoom = 18;

// 计算百度使用的分辨率
for (var i = 0; i <= maxZoom; i++) {
  resolutions[i] = Math.pow(2, maxZoom - i);
}
var tilegrid = new ol.tilegrid.TileGrid({
  origin: [0, 0],
  resolutions: resolutions    // 设置分辨率
});

// 创建百度地图的数据源
var baiduSource = new ol.source.TileImage({
  projection: 'EPSG:3857',
  tileGrid: tilegrid,
  tileUrlFunction: function (tileCoord, pixelRatio, proj) {
    var z = tileCoord[0];
    var x = tileCoord[1];
    var y = tileCoord[2];

    // 百度瓦片服务url将负数使用M前缀来标识
    if (x < 0) {
      x = -x;
    }
    if (y < 0) {
      y = -y;
    }
    return "http://online3.map.bdimg.com/onlinelabel/?qt=tile&x=" + x + "&y=" + y + "&z=" + z + "&styles=pl&udt=20151021&scaler=1&p=1";
  }
});

// 百度地图层
var baiduMapLayer2 = new ol.layer.Tile({
  source: baiduSource
});

// 创建地图
var map = new ol.Map({
  layers: [
    baiduMapLayer2
  ],
  view: new ol.View({
    // 设置成都为地图中心
    center: ol.proj.transform([117.23, 36.43], 'EPSG:4326', 'EPSG:3857'),
    /*extent: [53, 4, 73 ,135],*/
    zoom: 10,
    minZoom: 1,
    maxZoom: 10
  }),
  target: 'mapCon'
});
?
参考链接?一个简单的地图 | OpenLayers 3 Primer?
官网示例??OpenLayers Examples
本文来自互联网用户投稿,该文观点仅代表作者本人,不代表本站立场。本站仅提供信息存储空间服务,不拥有所有权,不承担相关法律责任。 如若内容造成侵权/违法违规/事实不符,请联系我的编程经验分享网邮箱:veading@qq.com进行投诉反馈,一经查实,立即删除!