LFW人脸数据库的简介
2023-12-31 22:32:13
LFW人脸数据库的简介
? LFW (Labled Faces in the Wild)人脸数据集:是目前人脸识别的常用测试集,其中提供的人脸图片均来源于生活中的自然场景,因此识别难度会增大,尤其由于多姿态、光照、表情、年龄、遮挡等因素影响导致即使同一人的照片差别也很大。并且有些照片中可能不止一个人脸出现,对这些多人脸图像仅选择中心坐标的人脸作为目标,其他区域的视为背景干扰。LFW数据集共有13233张人脸图像,每张图像均给出对应的人名,共有5749人,且绝大部分人仅有一张图片。每张图片的尺寸为250X250,绝大部分为彩色图像,但也存在少许黑白人脸图片。
导入包
# 绘制图像
import matplotlib.pyplot as plt
import numpy as np
# 数据降维
from sklearn.svm import SVC
# 数据拆分
from sklearn.model_selection import train_test_split as ts
# 计算模型的得分
from sklearn.metrics import accuracy_score
# 加载数据
from sklearn import datasets
# 网格搜索
from sklearn.model_selection import GridSearchCV
加载数据
# 加载人脸数据   labled faces wild

data = datasets.fetch_lfw_people(resize=1, min_faces_per_person=70)

x = data['data']
y = data['target']
faces = data['images']
# 像素不同,不同特征也就越多,这个时候就需要用到降维
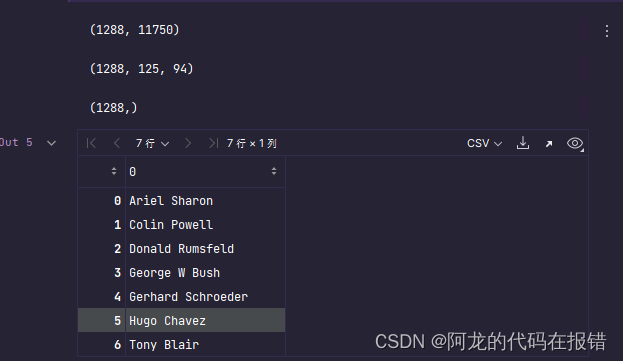
display(x.shape, faces.shape, y.shape)
target_names = data['target_names']
target_names

数据查看
# 数据查看
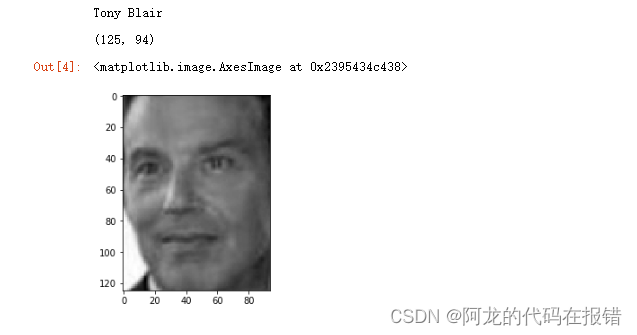
index = np.random.randint(0, 1288, size=1)[0]
face = faces[index]
name = y[index]

print(target_names[name])
display(face.shape)
plt.imshow(face)

PCA 数据降维
%%time
# 进行数据的降维
from sklearn.decomposition import PCA

pca = PCA(n_components=0.95)
X_pca = pca.fit_transform(x)
display(x.shape, X_pca.shape)

超参数选择
%%time
svc = SVC()
x_train, x_test, y_train, y_test = ts(X_pca, y, test_size=0.2, random_state=512)
prams = {
    'C': np.logspace(-3, 3, 20),
    'kernel': ['rbf', 'poly', 'linear'],
    'tol': [0.01, 0.001, 0.0001]
}
gc = GridSearchCV(estimator=svc, param_grid=prams, cv=5)
gc.fit(x_train, y_train)
# 获取最佳参数
gc.best_params_

使用最好的模型进行复训
# 使用最好的模型进行复训
best_model = gc.best_estimator_

best_model.fit(x_train, y_train)
获取得分
print('训练模型得分是:', best_model.score(x_train, y_train))
print('测试集模型得分:', best_model.score(x_test, y_test))
face_train,face_test = ts(faces, test_size=0.2, random_state=512)
# y_test真实的标签
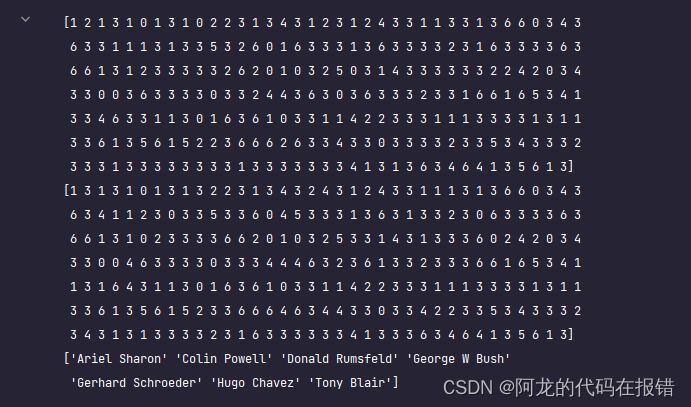
face_predict = best_model.predict(x_test)
print(face_predict)
print(y_test)
print(target_names)
accuracy_score(y_test, face_predict)


数据可视化
plt.figure(figsize=(5 * 2, 10 * 3))
for i in range(50):
    plt.subplot(10, 5, i + 1)
    plt.imshow(face_test[i], cmap='gray')
    plt.axis('off')
    predict = target_names[face_predict[i]].split(' ')[-1]
    true = target_names[y_test[i]].split(' ')[-1]
    plt.title(f'True{true}\nPred:{predict}')

文章来源:https://blog.csdn.net/yujinlong2002/article/details/135319761
本文来自互联网用户投稿,该文观点仅代表作者本人,不代表本站立场。本站仅提供信息存储空间服务,不拥有所有权,不承担相关法律责任。 如若内容造成侵权/违法违规/事实不符,请联系我的编程经验分享网邮箱:veading@qq.com进行投诉反馈,一经查实,立即删除!
本文来自互联网用户投稿,该文观点仅代表作者本人,不代表本站立场。本站仅提供信息存储空间服务,不拥有所有权,不承担相关法律责任。 如若内容造成侵权/违法违规/事实不符,请联系我的编程经验分享网邮箱:veading@qq.com进行投诉反馈,一经查实,立即删除!