机器学习 | 线性算法 —— 大禹治水
????????Machine-Learning: 《机器学习必修课:经典算法与Python实战》配套代码 - Gitee.com
? ? ? ? 如果说KNN算法体现了人们对空间距离的理解,
? ? ? ? 那么线性算法则体现了人们对事物趋势上的认识。
????????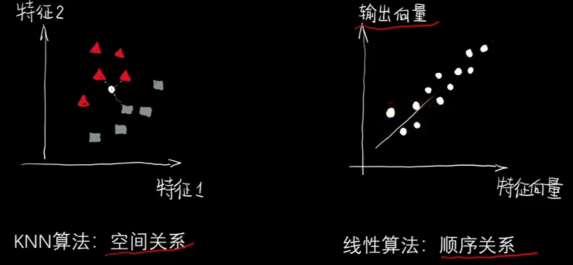
? ? ? ? 注意图中横纵坐标的不同。
? ? ? ??
? ? ? ? 线性回归、多项式回归多用于预测,逻辑回归多用于分类。
? ? ? ? 回归就是 找条 “线"。
? ? ? ? 看这条线本身便是回归任务,看这条线的两边便是分类任务。
????????
?一、线性回归
一元线性回归
- 最优化问题
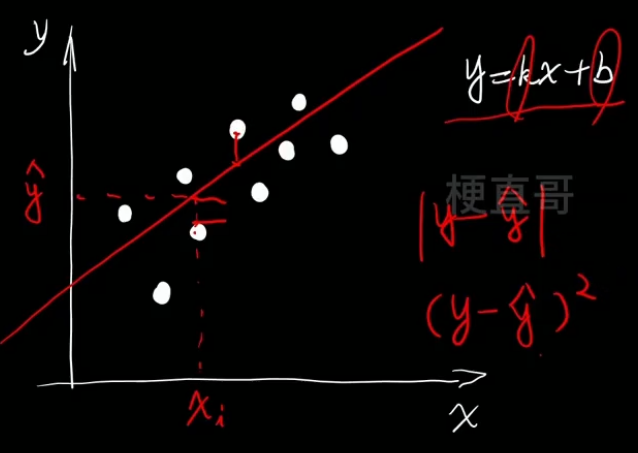
- 民主投票 Σ
- 距离的衡量
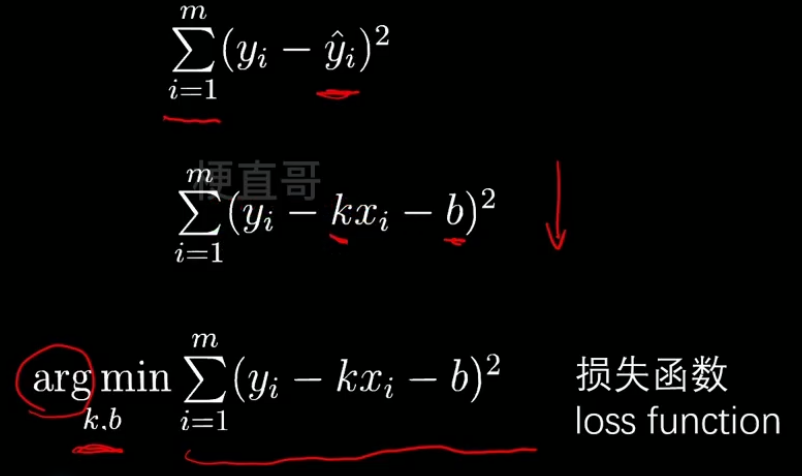
- 一元线性回归的解:
多元线性回归
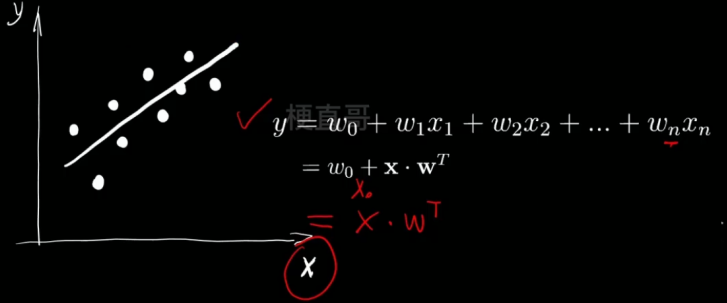
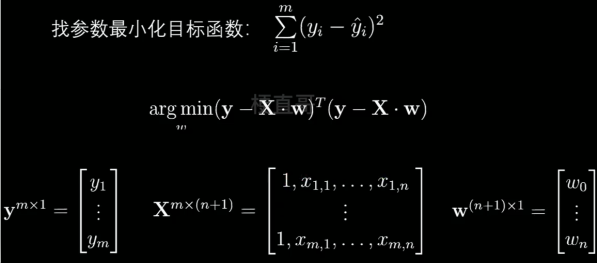
- 求解为:
多项式回归 —— 使用变量替换
?
?
?二、逻辑回归
逻辑回归(Logistic Function)
????????不光用来解决回归任务,也能解决分类任务。?
????????本质上还是找一条线,只不过关注的不是使数据更好的在这条线上,而是分布在这条线的两边。
? ? ? ? 通常用于分类问题时,只能解决二分类问题。
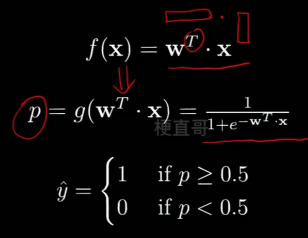
? ? ? ? sigmod函数可以将线性分布变换为非线性。
?????????
? ? ? ?则现在的逻辑即 给定X和Y,找到合适的w,拟合p
????????????????
????????既然是投票,本质还是求距离:
????????????????
? ? ? ? 逻辑回归的损失函数即:
????????????????
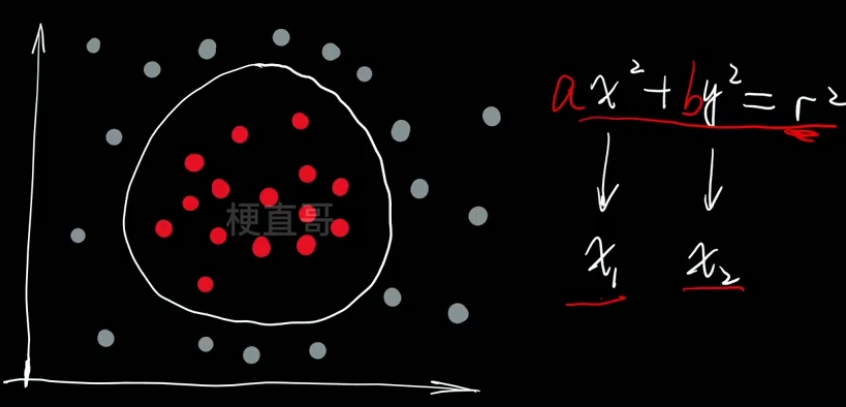
多项式逻辑回归?—— 使用变量替换
????????
三、线性回归代码实现
3.1、一元线性回归
import numpy as np
from sklearn import datasets
import matplotlib.pyplot as plt
import warnings
warnings.filterwarnings("ignore")boston = datasets.load_boston()print(boston.DESCR).. _boston_dataset:
Boston house prices dataset
---------------------------
**Data Set Characteristics:**
:Number of Instances: 506
:Number of Attributes: 13 numeric/categorical predictive. Median Value (attribute 14) is usually the target.
:Attribute Information (in order):
- CRIM per capita crime rate by town
- ZN proportion of residential land zoned for lots over 25,000 sq.ft.
- INDUS proportion of non-retail business acres per town
- CHAS Charles River dummy variable (= 1 if tract bounds river; 0 otherwise)
- NOX nitric oxides concentration (parts per 10 million)
- RM average number of rooms per dwelling
- AGE proportion of owner-occupied units built prior to 1940
- DIS weighted distances to five Boston employment centres
- RAD index of accessibility to radial highways
- TAX full-value property-tax rate per $10,000
- PTRATIO pupil-teacher ratio by town
- B 1000(Bk - 0.63)^2 where Bk is the proportion of black people by town
- LSTAT % lower status of the population
- MEDV Median value of owner-occupied homes in $1000's
:Missing Attribute Values: None
:Creator: Harrison, D. and Rubinfeld, D.L.
This is a copy of UCI ML housing dataset.
https://archive.ics.uci.edu/ml/machine-learning-databases/housing/
This dataset was taken from the StatLib library which is maintained at Carnegie Mellon University.
The Boston house-price data of Harrison, D. and Rubinfeld, D.L. 'Hedonic
prices and the demand for clean air', J. Environ. Economics & Management,
vol.5, 81-102, 1978. Used in Belsley, Kuh & Welsch, 'Regression diagnostics
...', Wiley, 1980. N.B. Various transformations are used in the table on
pages 244-261 of the latter.
The Boston house-price data has been used in many machine learning papers that address regression
problems.
.. topic:: References
- Belsley, Kuh & Welsch, 'Regression diagnostics: Identifying Influential Data and Sources of Collinearity', Wiley, 1980. 244-261.
- Quinlan,R. (1993). Combining Instance-Based and Model-Based Learning. In Proceedings on the Tenth International Conference of Machine Learning, 236-243, University of Massachusetts, Amherst. Morgan Kaufmann.
x = boston.data[:,5]
y = boston.target

x = x[y<50]
y = y[y<50]

plt.scatter(x,y)
plt.show()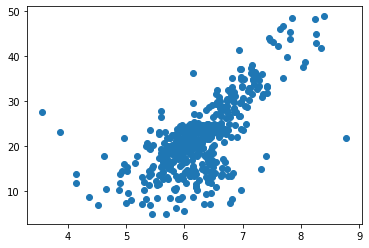
from sklearn.model_selection import train_test_split
x_train, x_test, y_train, y_test = train_test_split(x, y, test_size = 0.3, random_state = 0)

plt.scatter(x_train, y_train)
plt.show()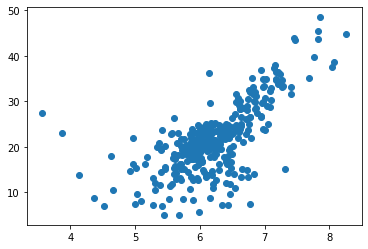
一元线性回归公式实现
def fit(x, y):
    a_up = np.sum((x-np.mean(x))*(y - np.mean(y)))
    a_bottom = np.sum((x-np.mean(x))**2)
    a = a_up / a_bottom
    b = np.mean(y) - a * np.mean(x)
    return a, b
a, b = fit(x_train, y_train)
a, b(8.056822140369603, -28.49306872447786)
plt.scatter(x_train, y_train)
plt.plot(x_train, a*x_train+ b, c='r')
plt.show()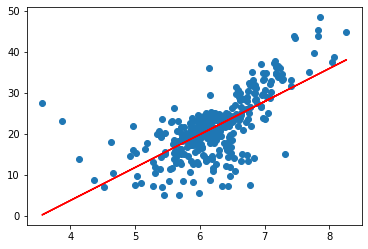
plt.scatter(x_test, y_test)
plt.plot(x_test, a*x_test+ b, c='r')
plt.show()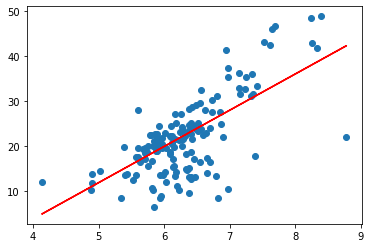
3.2、sklearn实现一元线性回归
from sklearn.linear_model import LinearRegression
lin_reg = LinearRegression()

lin_reg.fit(x_train.reshape(-1,1), y_train)
LinearRegression
LinearRegression()
y_predict = lin_reg.predict(x_test.reshape(-1,1))plt.scatter(x_test, y_test)
plt.plot(x_test, y_predict, c='r')
plt.show()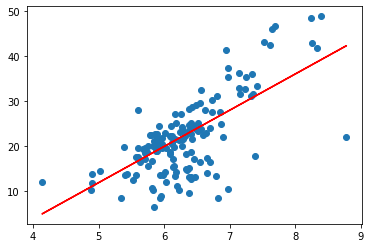
3.3、sklearn 实现多元线性回归
x = boston.data
y = boston.target

x = x[y<50]
y = y[y<50]

x_train, x_test, y_train, y_test = train_test_split(x, y, test_size = 0.3, random_state = 0)
lin_reg.fit(x_train, y_train)LinearRegression
LinearRegression()
lin_reg.score(x_test, y_test)0.7455942658788952
????????归一化吗?
????????多元线性回归中不需归一化,这是因为多元线性回归学习的就是每一维特征的权重。
from sklearn.preprocessing import StandardScaler
standardScaler = StandardScaler()
standardScaler.fit(x_train)
x_train = standardScaler.transform(x_train)
x_test = standardScaler.transform(x_test)
lin_reg.fit(x_train, y_train)LinearRegression
LinearRegression()
lin_reg.score(x_test, y_test)0.7455942658788963
?多项式回归与线性回归相同,只是需要添加新的特征。
Chapter-05/5-6 多项式回归实现.ipynb · 梗直哥/Machine-Learning - Gitee.com
3.4、模型评价之MSE、RMSE和MAE、R方
代码实现:?
Chapter-05/5-5 模型评价.ipynb · 梗直哥/Machine-Learning - Gitee.com
?MSE RMSE?
? ? ? ? 之所以开方,是由于因为平方可能会产生量纲问题,原来若是米,平方就变成平方米了。
? ? ? ? 无论是MSE还是RMSE,衡量的都是与直线的距离。
?????????
MAE?
???????? ?
?
? ? ? ? 通过对 二 中进行计算可得 MAE较小。
????????这是由于RMSE先对误差进行了平方,其实是放大了较大误差之间的差距。
????????因此在实际问题中RMSE的值越小,其意义越大。
????????
R方
?????????
? ? ? ? 若不能理解,可以将分子分母同时乘n分之一,则分母变成了方差,分子变成了MSE,可以理解为MSE消除了数据本身的影响,实现了归一化。
?????????
? ? ? ? R方越大,模型效果越好。?
MSE和MAE适用于误差相对明显的时候,而RMSE则是针对误差不是很明显的时候比较好。
MAE相比于MSE更能凸显异常值。
回归模型中loss函数一般使用 MAE/MSE/RMSE。
性能评估指标一般使用 R方。
四、逻辑回归代码实现
? ? ? ? 线性回归和多项式回归都是由解析解的,就是说是损失函数可以通过代数变换直接把参数推导出来。但是逻辑回归没有解析解,所以更加复杂。
? ? ? ? —— 一切都是因为逻辑回归的损失函数。
????????
? ? ? ? 举个例子理解一下:
????????????????二分类 ——?两党制? ? ? ? ? ? ? ? ? ?argmin ](w) ——?最佳政策
????????????????训练数据x ——?选民? ? ? ? ? ? ? ? ?求解w过程 ——?唱票
????????????????线性模型 ——?总统候选人? ? ? ? ?梯度 ——?激烈程度
????????????????参数w ——?竞选政策
????????????????Sigmoid函数 ——?选票
????????????????Log函数 —— 厌恶度
? ? ? ? ? ? ? ? Σ —— 投票
? ? ? ? ? ? ? ? J —— 大选总损失
? ? ? ? 这就需要 梯度 出场了。
? ? ? ? 代码实现:
?????? ?Chapter-05/5-8 线性逻辑回归.ipynb · 梗直哥/Machine-Learning - Gitee.com
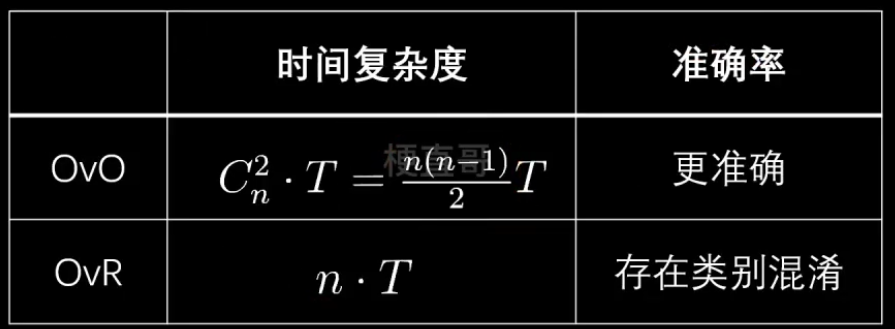
多分类:
????????OVO(One vs One?)Cn2个分类器
????????
??????????OVR (One vs Rest?) n个分类器
???????? ?
?
???????? ?
?
? ? ? ? 复杂逻辑回归、多分类代码实现:
????????Chapter-05/5-10 复杂逻辑回归实现.ipynb · 梗直哥/Machine-Learning - Gitee.com?
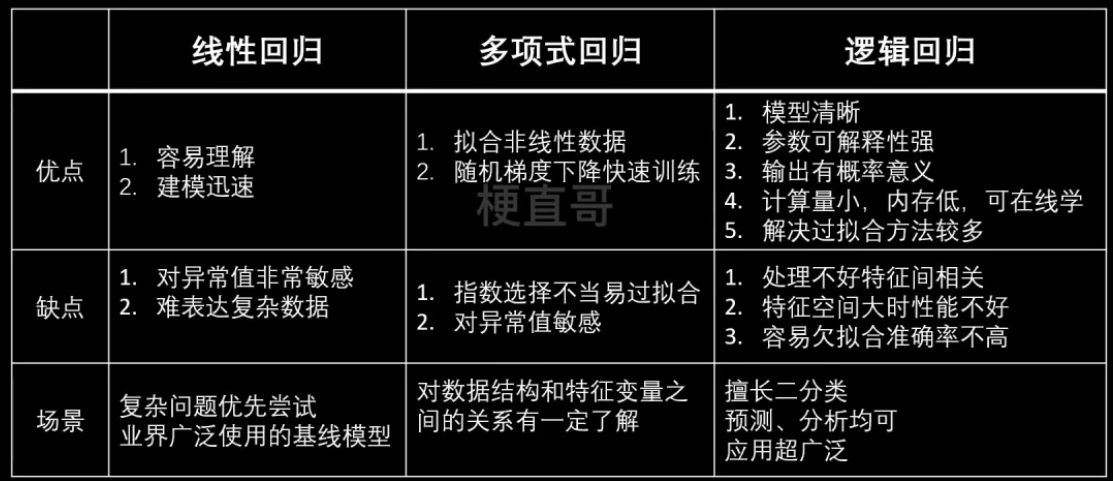
五、线性算法优缺点及适用条件
? ? ? ? KNN算法:大老粗
? ? ? ? ? ? ? ? 非参数模型,计算量大,好在数据无假设
? ? ? ? 线性算法:头脑敏锐
? ? ? ? ? ? ? ? 可解释性好,建模迅速,线性分布的假设
????????
本文来自互联网用户投稿,该文观点仅代表作者本人,不代表本站立场。本站仅提供信息存储空间服务,不拥有所有权,不承担相关法律责任。 如若内容造成侵权/违法违规/事实不符,请联系我的编程经验分享网邮箱:veading@qq.com进行投诉反馈,一经查实,立即删除!


