Linux CPU 数据 Metrics 指标解读
过去从未仔细了解过使用 top 和 htop 等命令时显式的CPU信息,本文我们详解解读和标注一下各个数据项的含义,同时和 Ganglia 显式的数据做一个映射。开始前介绍一个小知识,很多查看CPU的命令行工具都是 cat /proc/stat 里的数据,所以数据来源都是一样的,区别只在于显式格式,用户体验上。本文我们以 mpstat 和 uptime 命令为主,最后介绍一下 top 和 htop 的一些细微差异。
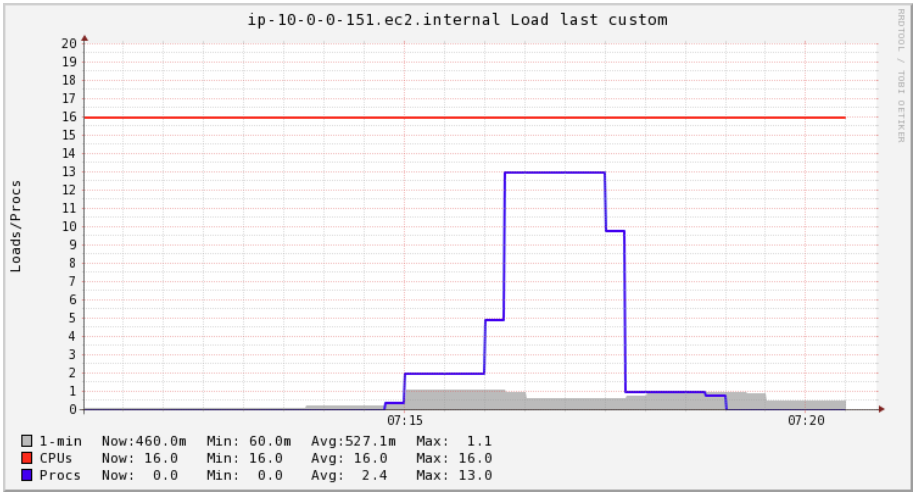
一般来说,CPU 的性能会分成两个维度来看,一个是:利用率,另一个是:(1/5/15分钟的)平均负载,这两种指标是不同的 (具体内容,年后补啦!收工了!今年肝稿 108 篇!累死~)


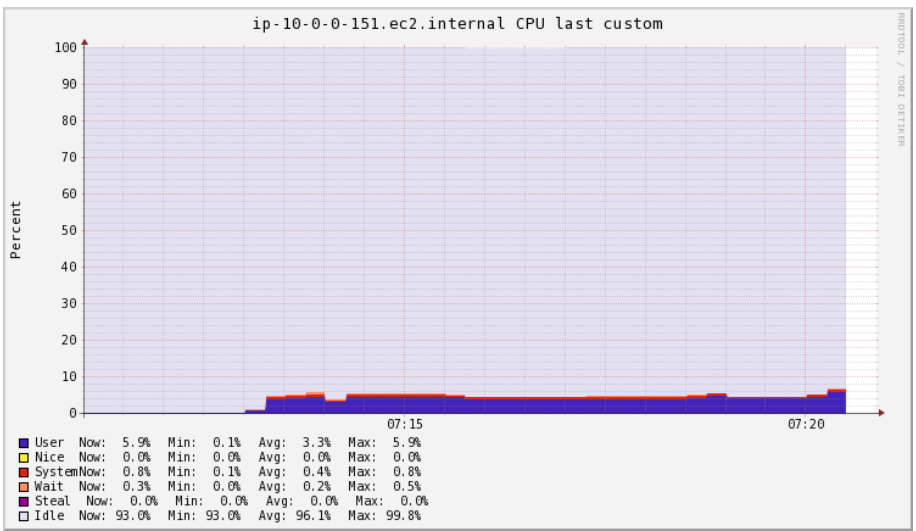
%user: Percentage of CPU utilization that occurred while executing at the user level (application).
%nice: Percentage of CPU utilization that occurred while executing at the user level with nice priority.
%system: Percentage of CPU utilization that occurred while executing at the system level (kernel).
%iowait: Percentage of time that the CPU or CPUs were idle during which the system had an outstanding disk I/O request.
%idle: Percentage of time that the CPU or CPUs were idle and the system did not have an outstanding disk I/O request.
%usr – % CPU usage at the user level
%nice – % CPU usage for user processes labeled “nice”
%sys – % CPU usage at the system (Linux kernel) level
%iowait – % CPU usage idling waiting on a disk read/write
%irq – % CPU usage handling hardware interrupts
%soft – % CPU usage handing software interrupts
%steal – % CPU usage being forced to wait for a hypervisor handling other virtual processors
%guest – % CPU usage spent running a virtual processor
%idle – % CPU usage on idle time (no processes, and not waiting on a disk read/write)
本文来自互联网用户投稿,该文观点仅代表作者本人,不代表本站立场。本站仅提供信息存储空间服务,不拥有所有权,不承担相关法律责任。 如若内容造成侵权/违法违规/事实不符,请联系我的编程经验分享网邮箱:veading@qq.com进行投诉反馈,一经查实,立即删除!