梯度下降实战(优化)
2023-12-13 23:23:43
批量梯度下降(BGD)
导入包
import numpy as np
import matplotlib.pyplot as plt
from sklearn.metrics import mean_squared_error
# 创建数据
x = np.random.rand(100, 1)
w, b = np.random.randint(1, 10, size=2)
y = w * x + b + np.random.rand(100, 1)

# 初始化系数
# 斜率和截距
theta = np.random.randn(2, 1)  # 随机瞎蒙
# 梯度下降  轮次
epoches = 2000
# 学习率
# learning_rate = 0.01
t0, t1 = 5, 1000


# 逆时衰减  learning 5/1000=0.005
def learning_rete_schedule(t):
    return t0 / (t1 + t)


# 偏置项 截距0 w0 系数 1
x_ = np.c_[x, np.ones((100, 1))]

# 实现梯度下降
for epoche in range(epoches):
    g = x_.T.dot(x_.dot(theta) - y)
    learning_rete = learning_rete_schedule(epoche)
    theta = theta - learning_rete * g
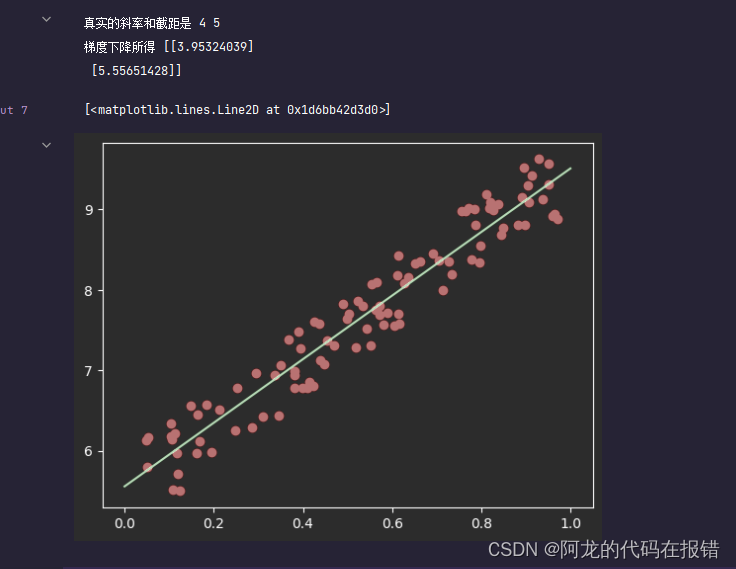
print("真实的斜率和截距是", w, b)
print('梯度下降所得', theta)

plt.scatter(x, y, color='red')
x_ = np.linspace(0, 1, 100)
y_ = x_ * theta[0, 0] + theta[1, 0]
plt.plot(x_, y_, color='green')
多元一次回归问题
import numpy as np

# 创建数据
x1 = np.random.rand(100, 7)  # 7个特征
w = np.random.randint(1, 10, size=(7, 1))
b = np.random.randint(1, 10, size=1)  # 一个截距
y = x1.dot(w) + b + np.random.randn(100, 1)
theta = np.random.randn(8, 1)  # 随机,
# 梯度下降,轮次
epoches1 = 20000
# 学习率
t0, t1 = 1, 100


# 逆时衰减  learning
def learning_rete_schedule(t):
    return t0 / (t1 + t)


# 偏置项,截距b 系数1
x1_ = np.c_[x1, np.ones((100, 1))]

for epoche1 in range(epoches1):
    g = x1_.T.dot(x1_.dot(theta) - y)
    learning_rete = learning_rete_schedule(epoche1)
    theta = theta - learning_rete * g
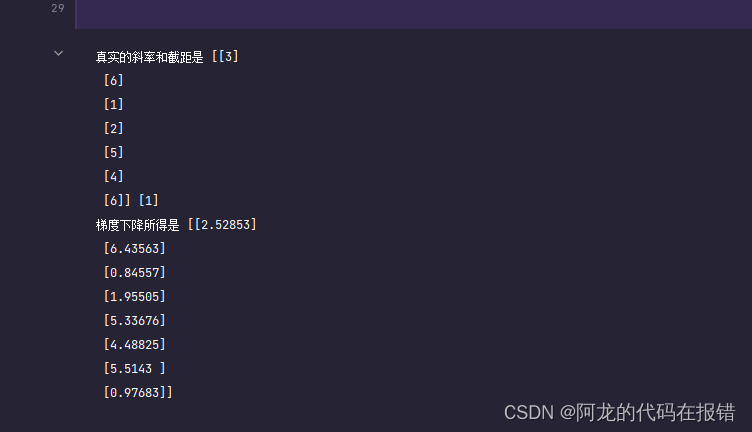
print('真实的斜率和截距是', w, b)
print("梯度下降所得是", theta.round(5))
随机梯度下降(SGD)
随机抽取一个样本
# 设置随机数据
rs = np.random.RandomState(seed=42)  # 固定了随机数的在种子

# 1.创建数据集X,y
X = 2 * rs.rand(100, 1)
w, b = rs.randint(1, 10, size=2)

y = w * X + b + np.random.randn(100, 1)
# 2、使用偏置项x_0 = 1 更新X
x_ = np.c_[X, np.ones((100, 1))]
# 创建一个超参数轮次和样本数量
epochs = 100
# 4、定义一个函数来调整学习率
t0, t1 = 1, 100

# 创建一个函数对学习率进行每一轮次的衰减
def learning_rate_schedule(t):
    return t0 / (t + t1)


# 5、初始化w0....wn 标准正态分布创建W
theta = rs.randn(2, 1)  # 最后一个是偏置项,截距

# 6、梯度下降计算
loss = []
for i in range(epochs):
    index = np.random.randint(0, 100, size=1)  # 数组意为
    X_i = x_[index]
    y_i = y[index]
    g = X_i.T.dot(X_i.dot(theta) - y_i)
    learning_rate = learning_rate_schedule(i)
    theta -= learning_rate * g
    y_pred = x_.dot(theta)  # 根据更新的额系数计,算预测的目标值
    loss.append(mean_squared_error(y, y_pred))
print('正确的斜率和截距:', w, b)
print('SGD计算的斜率截距是', theta)

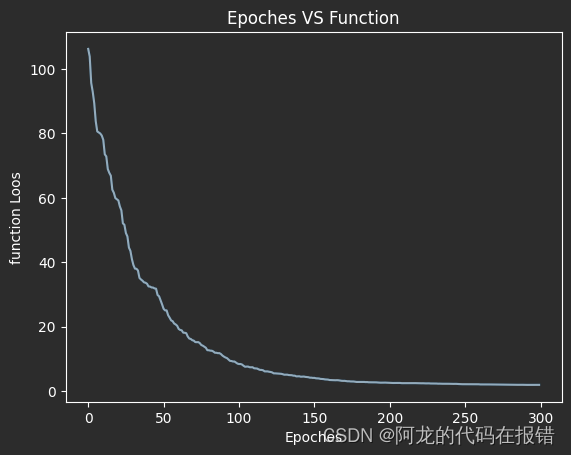
以图像的形式展示
plt.plot(loss)
plt.xlabel('Epoches')
plt.ylabel('function Loos')
plt.title('Epoches VS Function')
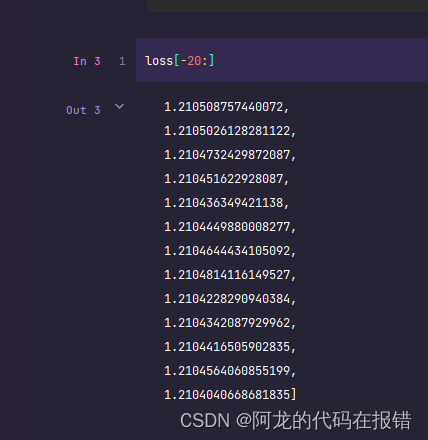
获取数据的loss的数值
随机梯度下降(优化)
import numpy as np
import matplotlib.pyplot as plt
from sklearn.metrics import mean_squared_error  # 均方误差

# 设置随机数据
rs = np.random.RandomState(seed=42)  # 固定了随机数的在种子

# 1.创建数据集X,y
X = 2 * rs.rand(100, 1)
w, b = rs.randint(1, 10, size=2)

y = w * X + b + np.random.randn(100, 1)
# 2、使用偏置项x_0 = 1 更新X
x_ = np.c_[X, np.ones((100, 1))]
# 创建一个超参数轮次和样本数量
epochs = 10
# 4、定义一个函数来调整学习率
t0, t1 = 1, 100


def learning_rate_schedule(t):
    return t0 / (t + t1)


# 5、初始化w0....wn 标准正态分布创建W
theta = rs.randn(2, 1)  # 最后一个是偏置项,截距

# 6、梯度下降计算
loss = []
for i in range(epochs):
    indexes = np.arange(100)

    np.random.shuffle(indexes)
    X_ = x_[indexes]  # 对数据进行重拍
    y_ = y[indexes]
    for X_1, y_1 in zip(X_, y_):
        X_1 = X_1.reshape(-1,2)
        y_1 = y_1.reshape(-1,1)
        g = X_1.T.dot(X_1.dot(theta) - y_1)
        learning_rate = learning_rate_schedule(i)
        theta -= learning_rate * g
    y_pred = x_.dot(theta)  # 根据公衡新的系数,预测值
    loss.append(mean_squared_error(y, y_pred))
print('正确的斜率和截距:', w, b)
print('SGD计算的斜率截距是', theta)

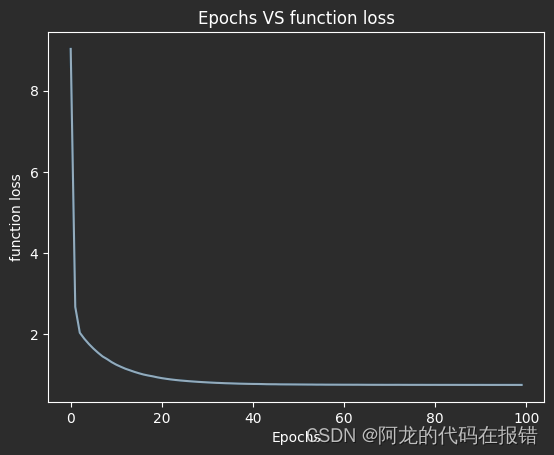
图形的方式查看训练的效果
plt.plot(loss)
plt.xlabel('Epochs')
plt.ylabel('function loss')
plt.title('Epochs VS function loss')
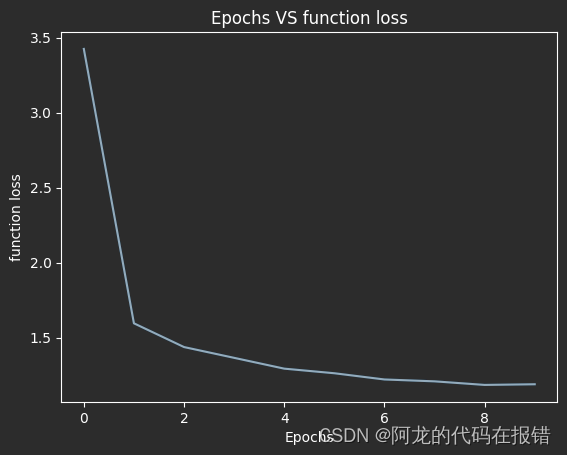
在同样是一万轮的训练情况下:
优化后
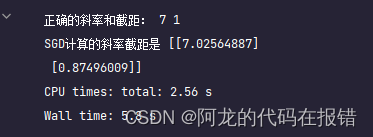
优化前

随机梯度下降-多元线性回归
%%time
import numpy as np
import matplotlib.pyplot as plt
from sklearn.metrics import mean_squared_error  # 均方误差

# 设置随机数据
rs = np.random.RandomState(seed=42)  # 固定了随机数的在种子

# 1.创建数据集X,y
X = 2 * rs.rand(100, 7)
w = rs.randint(1, 10, size=(7, 1))
b = rs.randint(1, 10, size=(1, 1))
y = X.dot(w) + b + np.random.randn(100,1)
# 2、使用偏置项x_0 = 1 更新X
x_ = np.c_[X, np.ones((100, 1))]
# 创建一个超参数轮次和样本数量
epochs = 100
# 4、定义一个函数来调整学习率
t0, t1 = 1, 100

def learning_rate_schedule(t):
    return t0 / (t + t1)

# 5、初始化w0....wn 标准正态分布创建W
theta = rs.randn(8, 1)  # 最后一个是偏置项,截距

# 6、梯度下降计算
loss = []
for i in range(epochs):
    indexes = np.arange(100)
    np.random.shuffle(indexes)
    X_ = x_[indexes]  # 对数据进行重拍
    y_ = y[indexes]
    for X_1, y_1 in zip(X_, y_):
        X_1 = X_1.reshape(1, -1)
        y_1 = y_1.reshape(1, -1)
        g = X_1.T.dot(X_1.dot(theta) - y_1)
        learning_rate = learning_rate_schedule(i)
        theta -= learning_rate * g
    y_pred = x_.dot(theta)  # 根据公衡新的系数,预测值
    loss.append(mean_squared_error(y, y_pred))
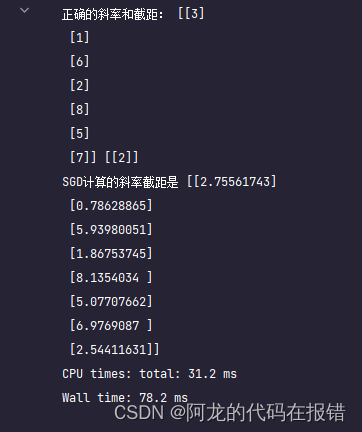
print('正确的斜率和截距:', w, b)
print('SGD计算的斜率截距是', theta)
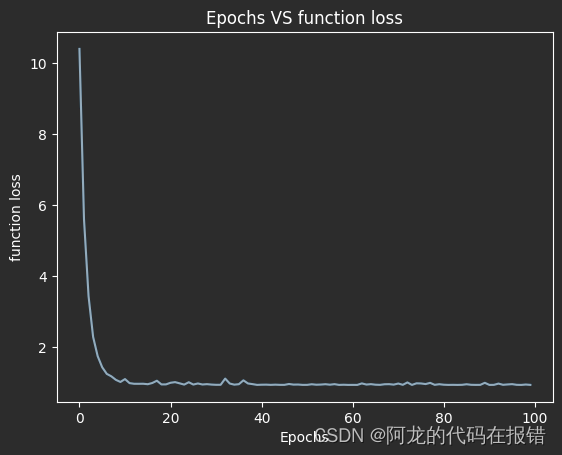
plt.plot(loss)
plt.xlabel('Epochs')
plt.ylabel('function loss')
plt.title('Epochs VS function loss')
图形显示训练的效果
 scikit_learn中的SGD算法
sklearn中的随机梯度下降
from sklearn.linear_model import SGDRegressor
import numpy as np
import matplotlib.pyplot as plt
from sklearn.metrics import mean_squared_error # 均方误差
rs = np.random.RandomState(seed=42) # 固定随机数种子
# 1. 创建数据集 X,Y
xr = 2 * rs.randn(100,7)
wr = rs.randint(1,10,size=(7,1))
br = rs.randint(1,10,size=(1,1))
y = X.dot(w) + b + np.random.randn(100,1)
# 2、 使用偏置项x_0 =1 更新x
xr_ = np.c_[X,np.ones((100,1))]

model = SGDRegressor(fit_intercept=False,max_iter=2000,tol=1e-5)
model.fit(xr_,y.ravel())
model_score = model.score(xr_,y)
print(model_score)
print('scilit-learn 模型,SGD返回的系数是',model.coef_)
print('正确的斜率和截距',w.ravel(),b)

小批量梯度下降-MBGD
import numpy as np
import matplotlib.pyplot as plt
from sklearn.metrics import mean_squared_error  #均方误差
# 创建数据集
X = np.random.rand(100, 1)
w, b = np.random.randint(1, 10, size=2)
y = w * X + b + np.random.randn(100, 1)
#  使用偏执x_0 = 1 更新X
X = np.c_[X, np.ones((100, 1))]

# 定义一个函数来调整学习率
t0, t1 = 1, 100


def learing_rate_schedule(t):
    return t0 / (t1 + t)


# 创建超参数轮次,样本数量,小批量数量
epochs = 100
n = 100
batch_size = 16
num_batches = int(n / batch_size)

# 初始化 w0.....wn 标准正态分布创建W
theta = np.random.randn(2, 1)
loss = []

# 梯度下降
for i in range(epochs):
    indexes = np.arange(100)
    np.random.shuffle(indexes)
    X = X[indexes]
    y = y[indexes]
    learing_rate = learing_rate_schedule(epochs)
    for i in range(num_batches):
        X_batch = X[batch_size * i: batch_size * (1 + i)]  # 16个样本
        y_batch = y[batch_size * i: batch_size * (1 + i)]
        g = X_batch.T.dot(X_batch.dot(theta) - y_batch)
        theta -= g * learing_rate
    y_pred = X.dot(theta)
    loss.append(mean_squared_error(y, y_pred))
print("正确的斜率和截距是", w, b)
print('SGD计算的斜率截距是:', theta)

图形显示训练效果
plt.plot(loss)
plt.xlabel('Epochs')
plt.ylabel('function loss')
plt.title('Epochs VS function loss')
多元一次回归问题
x = np.random.randn(100, 5)
w = np.random.randint(1, 10, size=(5, 1))
b = np.random.randint(1, 10, size=(1, 1))
y1 = x.dot(w) + b + np.random.randn(100, 1)
# 设置偏置项
x = np.c_[x, np.ones((100, 1))]
# 3、 定义一个函数来调整学习率
t0, t1 = 1, 100
def learing_rate_schedule(t):
    return t0 / (t + t1)
# 创建 超参数轮次、样本数量、小批数量
epochs = 50
n = 100
batch_size = 16
num_batches = int(n / batch_size)  # 6次
# 5、初始化 w0....wn 标准的正态分布创建w
theta = np.random.randn(6, 1)
loss = []
for epoch in range(epochs):
    indexes = np.arange(100)
    np.random.shuffle(indexes)
    X = x[indexes]
    y = y1[indexes]
    learning_rate = learing_rate_schedule(epoch)
    for i in range(num_batches):
        X_batch = X[batch_size * i : batch_size * (1 + i)] # 16个样本
        y_batch = y[batch_size * i : batch_size * (1 + i)]
        g = X_batch.T.dot(X_batch.dot(theta) - y_batch)
        theta -= g * learning_rate
    y1_pred = x.dot(theta)
    loss.append(mean_squared_error(y1,y1_pred))
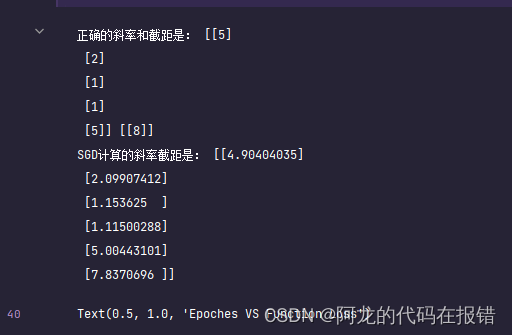
print('正确的斜率和截距是:',w,b)
print('SGD计算的斜率截距是:',theta)
图形展示训练效果
plt.plot(loss)
plt.xlabel('Epoches')
plt.ylabel('Function Loss')
plt.title('Epoches VS Function Loss')

数据不可能达到百分之百正确,只要模型堪用就可以
文章来源:https://blog.csdn.net/yujinlong2002/article/details/134952504
本文来自互联网用户投稿,该文观点仅代表作者本人,不代表本站立场。本站仅提供信息存储空间服务,不拥有所有权,不承担相关法律责任。 如若内容造成侵权/违法违规/事实不符,请联系我的编程经验分享网邮箱:veading@qq.com进行投诉反馈,一经查实,立即删除!
本文来自互联网用户投稿,该文观点仅代表作者本人,不代表本站立场。本站仅提供信息存储空间服务,不拥有所有权,不承担相关法律责任。 如若内容造成侵权/违法违规/事实不符,请联系我的编程经验分享网邮箱:veading@qq.com进行投诉反馈,一经查实,立即删除!
