matplotlib 默认属性和绘图风格
2023-12-13 03:05:33
matplotlib 默认属性
- 一、绘图风格
-
- 1. 绘制叠加折线图
- 2. Solarize_Light2
- 3. _classic_test_patch
- 4. _mpl-gallery
- 5. _mpl-gallery-nogrid
- 6. bmh
- 7. classic
- 8. fivethirtyeight
- 9. ggplot
- 10. grayscale
- 11. seaborn
- 12. seaborn-bright
- 13. seaborn-colorblind
- 14. seaborn-dark
- 15. seaborn-dark-palette
- 16. seaborn-darkgrid
- 17. seaborn-talk
- 18. seaborn-ticks
- 19. fast
- 20. seaborn-deep
- 20. seaborn-muted
- 21. seaborn-notebook
- 22. seaborn-paper
- 23. seaborn-pastel
- 24. seaborn-poster
- 25. seaborn-white
- 26. seaborn-whitegrid
- 27. tableau-colorblind10
- 27. dark_background
- 二、matplotlib 默认属性
一、绘图风格
print(plt.style.available) # 查看可选风格
plt.style.use('fivethirtyeight') # 使用那种风格
1.参数可以是文件路径 ...\site-packages\matplotlib\mpl-data\stylelib可参考此路径下文件
2.这个文件夹下,都是存放绘图风格文件,必须是“.mplstyle”结尾文件
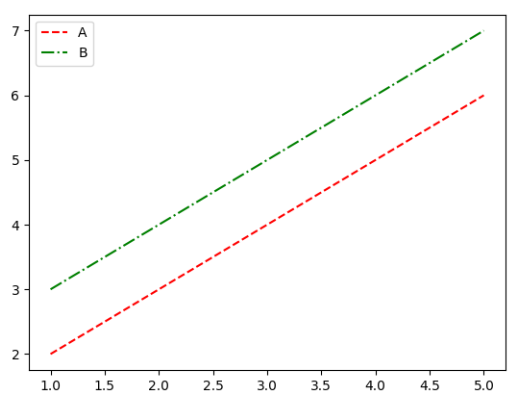
1. 绘制叠加折线图
from matplotlib import pyplot as plt
plt.style.use('Solarize_Light2')  # 设置制图风格
plt.plot([1, 2, 3, 4, 5], [2, 3, 4, 5, 6], linestyle='--', c='r')
plt.plot([1, 2, 3, 4, 5], [3, 4, 5, 6, 7], linestyle='-.', c='g')
plt.legend(['A', 'B'])
plt.show()
2. Solarize_Light2
plt.style.use('Solarize_Light2')

3. _classic_test_patch
plt.style.use('_classic_test_patch')

4. _mpl-gallery
plt.style.use('_mpl-gallery')

5. _mpl-gallery-nogrid
plt.style.use('_mpl-gallery-nogrid')

6. bmh
plt.style.use('bmh')

7. classic
plt.style.use('classic') # 超出坐标轴以外,是遮掩状态的

8. fivethirtyeight
plt.style.use('fivethirtyeight')

9. ggplot
plt.style.use('ggplot')

10. grayscale
plt.style.use('grayscale')

11. seaborn
plt.style.use('seaborn')

12. seaborn-bright
plt.style.use('seaborn-bright')

文章来源:https://blog.csdn.net/chenliang1038/article/details/134811270
本文来自互联网用户投稿,该文观点仅代表作者本人,不代表本站立场。本站仅提供信息存储空间服务,不拥有所有权,不承担相关法律责任。 如若内容造成侵权/违法违规/事实不符,请联系我的编程经验分享网邮箱:veading@qq.com进行投诉反馈,一经查实,立即删除!
本文来自互联网用户投稿,该文观点仅代表作者本人,不代表本站立场。本站仅提供信息存储空间服务,不拥有所有权,不承担相关法律责任。 如若内容造成侵权/违法违规/事实不符,请联系我的编程经验分享网邮箱:veading@qq.com进行投诉反馈,一经查实,立即删除!