Python自动化操作PPT,直接封神。来学起来
1.PPT自动化能干什么?有什么优势?
-
它可以代替你自动制作PPT
-
它可以减少你调整用于调整PPT格式的时间
-
它可以让数据报告风格一致
-
总之就是:它能提高你的工作效率!让你有更多时间去做其他事情!
2.使用win32com操作ppt
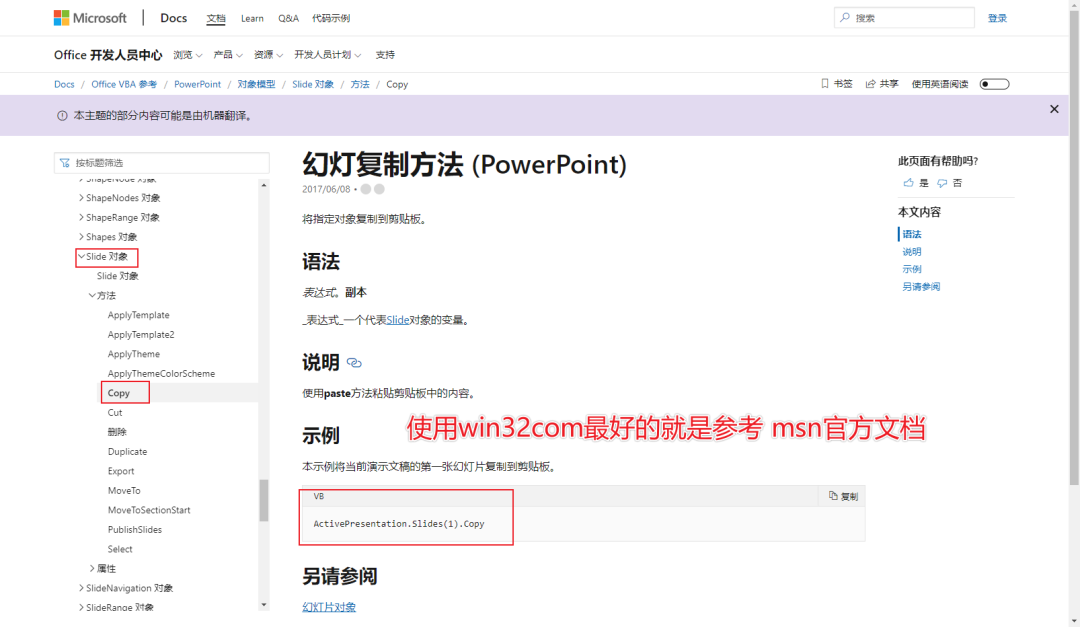
官方文档:https://docs.microsoft.com/zh-cn/office/vba/api/powerpoint.shape.copy
2.1 pip安装win32com
pip?install?pypiwin32
由于我已经安装过了,这里提示已经安装

2.2 win32com复制ppt模板
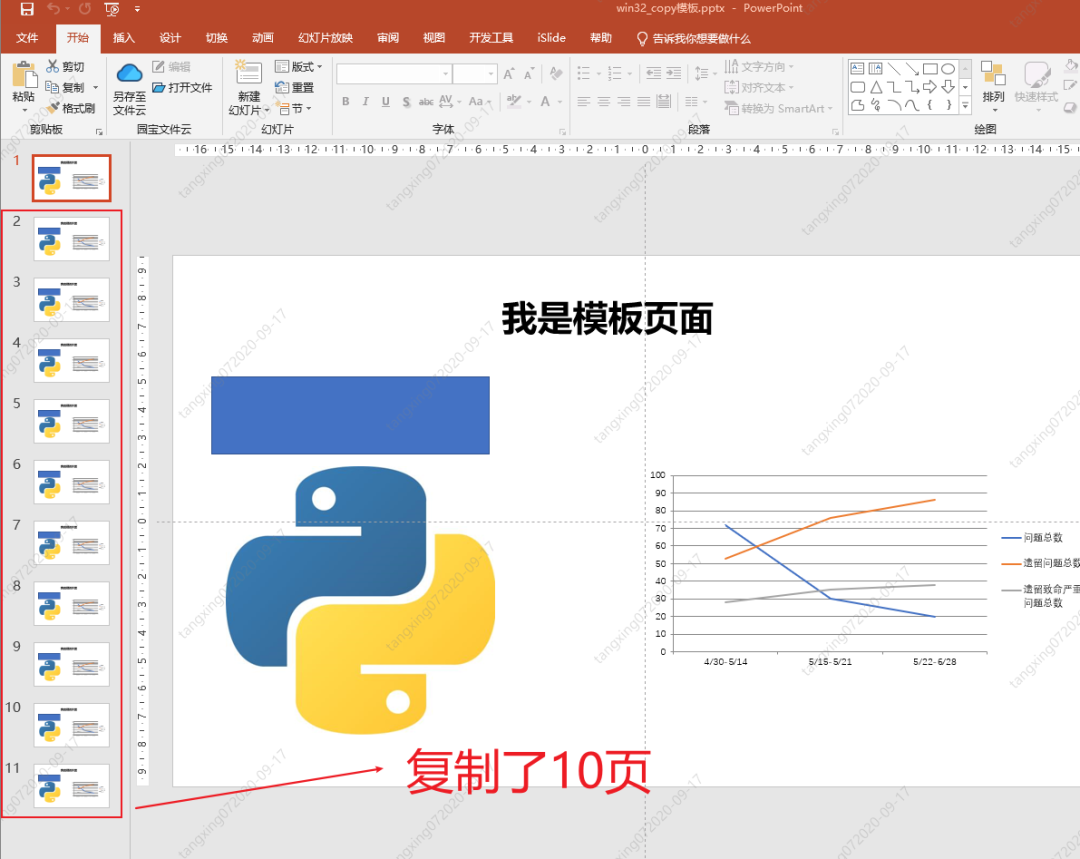
有时候我们需要对ppt的模板进行复制,然后再添加相应内容,由于python-pptx对复制模板也没有很好的支持(我没找到~忧伤),所以我们用win32com对模板页进行复制,然后再用python-pptx增加ppt内容。
参考官方文档:https://docs.microsoft.com/zh-cn/office/vba/api/powerpoint.slide.copy
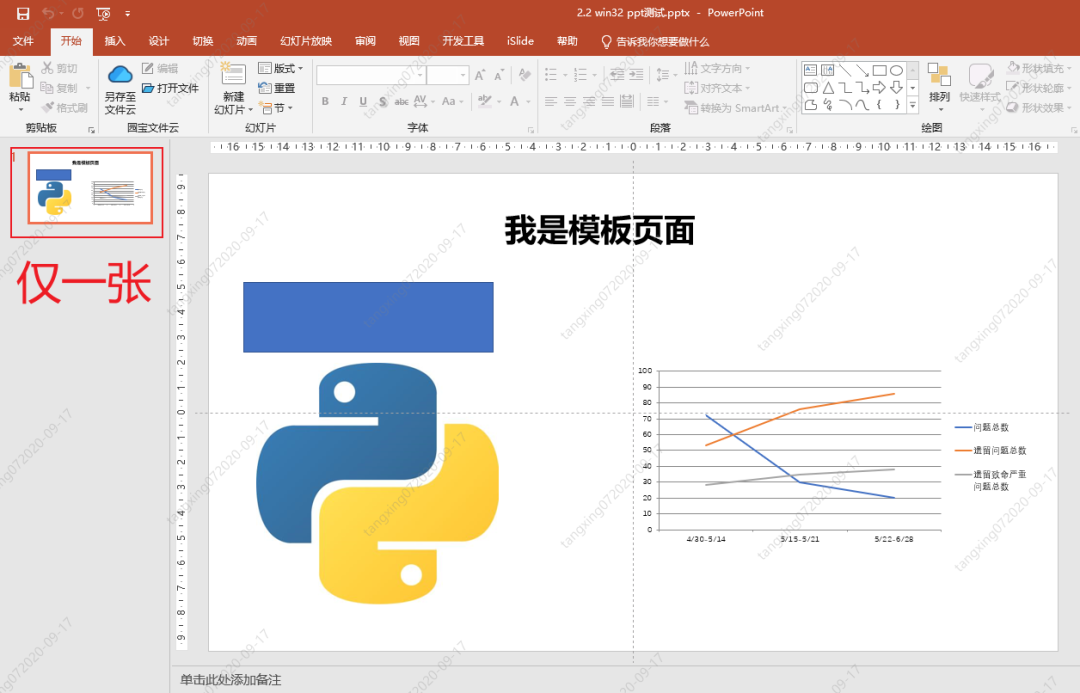
先准备好一张模板:?2.2 win32 ppt测试.pptx
示例代码:
import?win32com
from?win32com.client?import?Dispatch
import?os

ppt?=?Dispatch('PowerPoint.Application')
#?或者使用下面的方法,使用启动独立的进程:
#?ppt?=?DispatchEx('PowerPoint.Application')

#?如果不声明以下属性,运行的时候会显示的打开word
ppt.Visible?=?1??#?后台运行
ppt.DisplayAlerts?=?0??#?不显示,不警告

#?创建新的PowerPoint文档
#?pptSel?=?ppt.Presentations.Add()?
#?打开一个已有的PowerPoint文档
pptSel?=?ppt.Presentations.Open(os.getcwd()?+?"\\"?+?"2.2?win32?ppt测试.pptx")

#?复制模板页
pptSel.Slides(1).Copy()
#设置需要复制的模板页数
pageNums?=?10
#?粘贴模板页
for?i?in?range(pageNums):
????pptSel.Slides.Paste()

#?pptSel.Save()??#?保存
pptSel.SaveAs(os.getcwd()?+?"\\"?+?"win32_copy模板.pptx")??#?另存为
pptSel.Close()??#?关闭?PowerPoint?文档
ppt.Quit()??#?关闭?office
效果如下:

3.python-pptx 创建PPT、复制页面
官方文档:https://python-pptx.readthedocs.io/en/latest/
3.1 pip安装python-pptx
安装方法:
pip?install?python-pptx
我已经安装过了,故提示已经安装

3.2 python-pptx 复制页面
使用python-pptx进行复制没有找到合适的方法,有以下两种解决办法:
-
使用win32com对ppt模板进行复制
-
增加模板ppt数量,然后使用python-pptx对不需要的模板页进行删减操作
3.3 python-pptx 删除页面
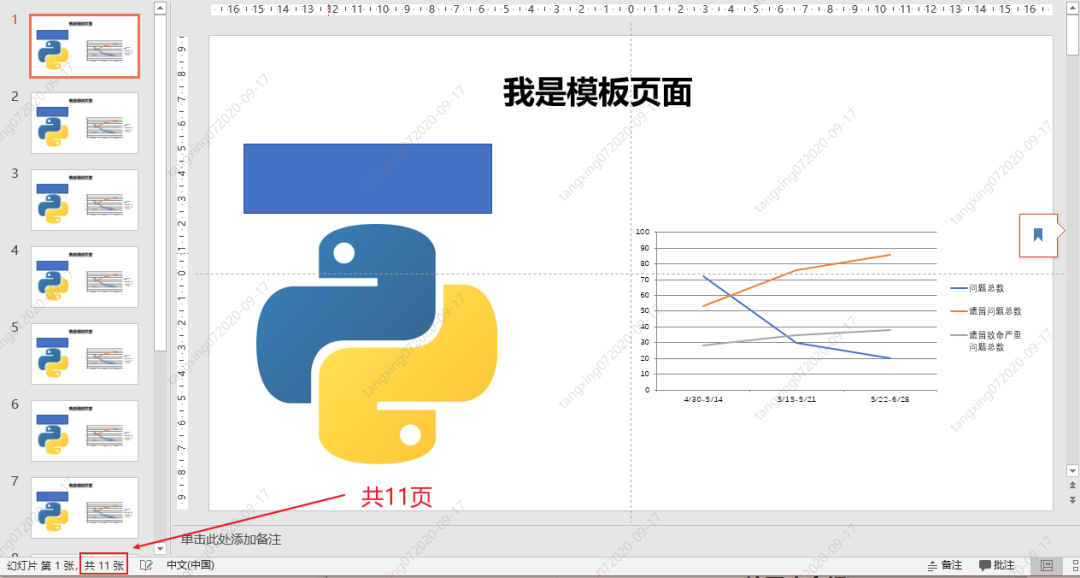
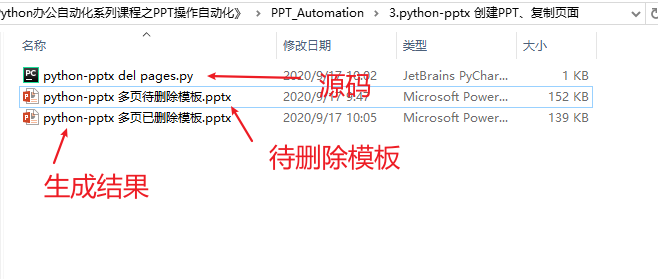
python-pptx 多页待删除模板.pptx:
示例代码:
from?pptx?import?Presentation

#?删除某一页ppt
def?del_slide(prs,index):
????slides?=?list(prs.slides._sldIdLst)
????prs.slides._sldIdLst.remove(slides[index])

#?3.3?python-pptx?删除页面
def?fun3_3():
????#?打开ppt
????ppt?=?Presentation('python-pptx?多页待删除模板.pptx')

????#?获取所有页
????slides?=?ppt.slides
????number_pages?=?len(slides)
????print("删除前ppt一共",number_pages,"页面")

????#?设置需要删除的页面数量
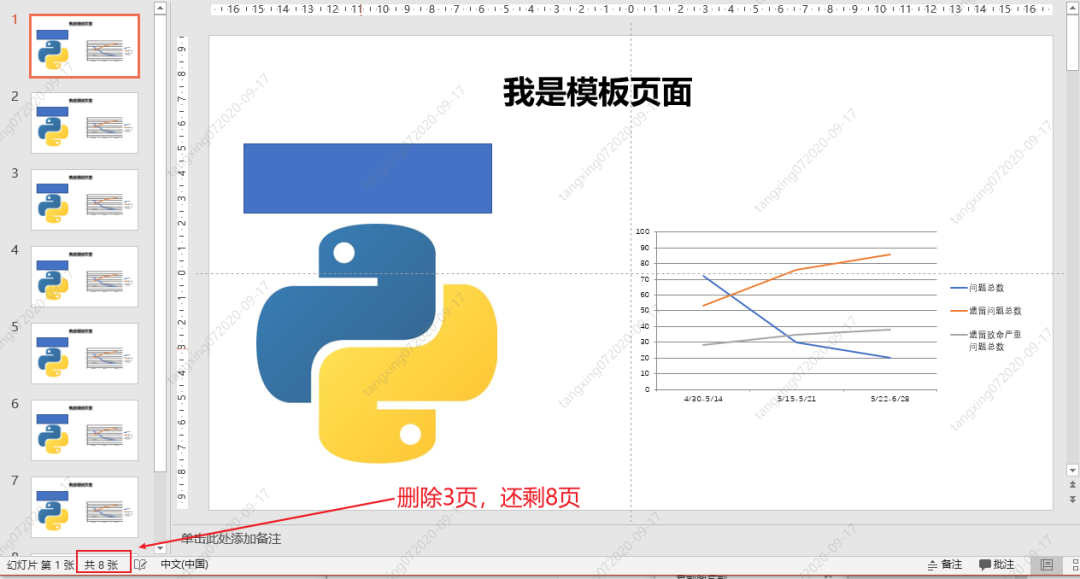
????delPageNums?=?3
????#?进行删除操作(每次都删除第一张ppt)
????for?index?in?range(delPageNums):
????????del_slide(ppt,0)

????#?再次获取所有页
????slides?=?ppt.slides
????number_pages?=?len(slides)
????print("删除后ppt一共",number_pages,"页面")

????ppt.save('python-pptx?多页已删除模板.pptx')
????print('生成完毕')

if?__name__?==?'__main__':
????fun3_3()
执行效果:
3.4 新建页面
示例代码:
from?pptx?import?Presentation

#?新建ppt
ppt?=?Presentation()

#?新建页面
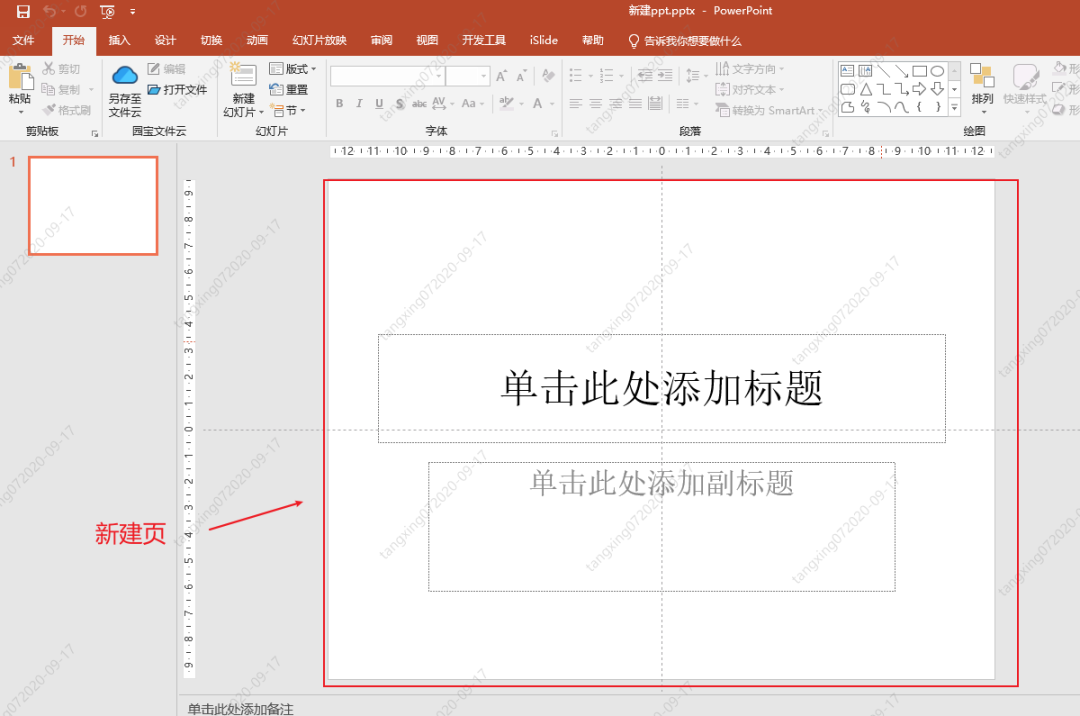
slide?=?ppt.slides.add_slide(ppt.slide_layouts[0])

#?保存ppt
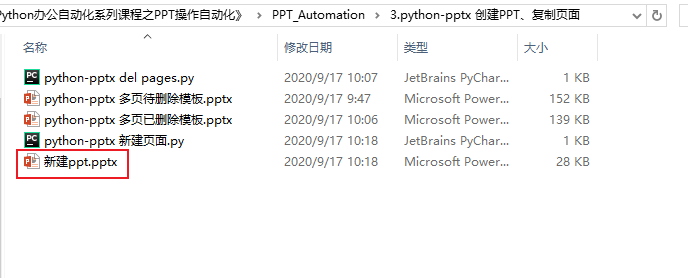
ppt.save('新建ppt.pptx')
效果如下:
4.python-pptx 插入文字、表格、形状并设置样式
模板ppt:

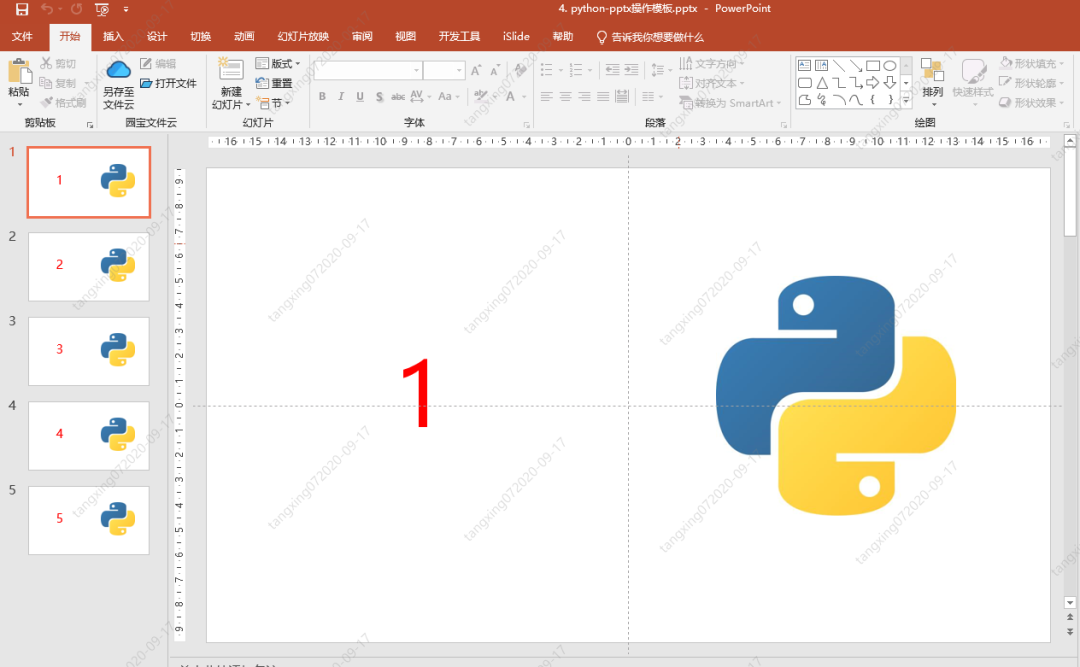
接下来,我们就在此模板上进行我们的操作演示
4.1 python-pptx 添加文字并设置样式
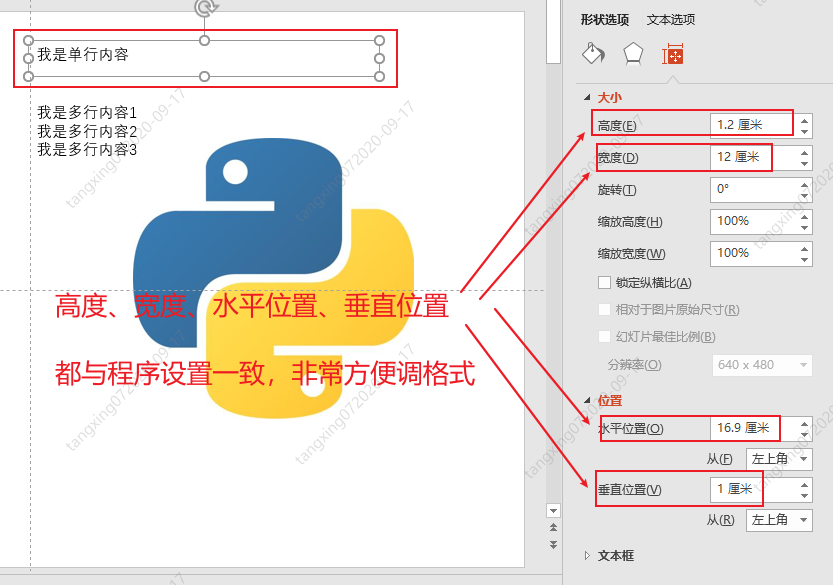
4.1.1 添加单行文字与多行文字
示例代码:
from?pptx?import?Presentation
from?pptx.util?import?Pt,Cm

#?打开已存在ppt
ppt?=?Presentation('4.?python-pptx操作模板.pptx')

#?设置添加到当前ppt哪一页
n_page?=?0
singleLineContent?=?"我是单行内容"
multiLineContent?=?\
"""我是多行内容1
我是多行内容2
我是多行内容3
"""

#?获取需要添加文字的页面对象
slide?=?ppt.slides[n_page]

#?添加单行内容

#?设置添加文字框的位置以及大小
left,?top,?width,?height?=?Cm(16.9),?Cm(1),?Cm(12),?Cm(1.2)
#?添加文字段落
new_paragraph1?=?slide.shapes.add_textbox(left=left,?top=top,?width=width,?height=height).text_frame
#?设置段落内容
new_paragraph1.paragraphs[0].text?=?singleLineContent
#?设置文字大小
new_paragraph1.paragraphs[0].font.size?=?Pt(15)


#?添加多行

#?设置添加文字框的位置以及大小
left,?top,?width,?height?=?Cm(16.9),?Cm(3),?Cm(12),?Cm(3.6)
#?添加文字段落
new_paragraph2?=?slide.shapes.add_textbox(left=left,?top=top,?width=width,?height=height).text_frame
#?设置段落内容
new_paragraph2.paragraphs[0].text?=?multiLineContent
#?设置文字大小
new_paragraph2.paragraphs[0].font.size?=?Pt(15)


#?保存ppt
ppt.save('4.1?添加文字.pptx')
效果如下:
4.1.2 设置文字框样式与文字样式
示例代码:
from?pptx?import?Presentation
from?pptx.util?import?Pt,Cm
from?pptx.dml.color?import?RGBColor
from?pptx.enum.text?import?MSO_VERTICAL_ANCHOR,?PP_PARAGRAPH_ALIGNMENT
from?pptx.enum.text?import?PP_ALIGN


#?打开已存在ppt
ppt?=?Presentation('4.?python-pptx操作模板.pptx')

#?获取需要添加文字的页面对象
slide?=?ppt.slides[0]

#?设置添加文字框的位置以及大小
left,?top,?width,?height?=?Cm(16.9),?Cm(1),?Cm(12),?Cm(1.2)
#?添加文字框?slide.shapes.add_textbox(距离左边,距离顶端,宽度,高度)
textBox?=?slide.shapes.add_textbox(left=left,?top=top,?width=width,?height=height)

#?调整文本框背景颜色
textBoxFill?=?textBox.fill
textBoxFill.solid()??#?纯色填充
textBoxFill.fore_color.rgb?=?RGBColor(187,?255,?255)

#?文本框边框样式调整
line?=?textBox.line
line.color.rgb?=?RGBColor(0,?255,?0)
line.width?=?Cm(0.1)

#?获取文本框对象
tf?=?textBox.text_frame

#?文本框样式调整
tf.margin_bottom?=?Cm(0.1)??#?下边距
tf.margin_left?=?0??#?左边距
tf.vertical_anchor?=?MSO_VERTICAL_ANCHOR.BOTTOM??#?对齐文本方式:底端对齐
tf.word_wrap?=?True??#?文本框的文字自动对齐

#?设置内容
tf.paragraphs[0].text?=?'这是一段文本框里的文字'

#?字体样式调整
tf.paragraphs[0].alignment?=?PP_ALIGN.CENTER??#?对齐方式
tf.paragraphs[0].font.name?=?'微软雅黑'??#?字体名称
tf.paragraphs[0].font.bold?=?True??#?是否加粗
tf.paragraphs[0].font.italic?=?True??#?是否斜体
tf.paragraphs[0].font.color.rgb?=?RGBColor(255,?0,?0)??#?字体颜色
tf.paragraphs[0].font.size?=?Pt(20)??#?字体大小

#?保存ppt
ppt.save('4.1.2?设置文字框与字体样式.pptx')
效果如下:

代码详解
-
添加文本框
#?添加文字框?slide.shapes.add_textbox(距离左边,距离顶端,宽度,高度) textBox?=?slide.shapes.add_textbox(left=left,?top=top,?width=width,?height=height) -
设置文本框背景
#?调整文本框背景颜色
textBoxFill?=?textBox.fill
textBoxFill.solid()??#?纯色填充
textBoxFill.fore_color.rgb?=?RGBColor(187,?255,?255)
RGB颜色参考:http://www.wahart.com.hk/rgb.htm
-
设置文本框边框样式
#?文本框边框样式调整 line?=?textBox.line line.color.rgb?=?RGBColor(0,?255,?0) line.width?=?Cm(0.1) -
设置文本框文字样式
#?获取文本框文字对象
tf?=?textBox.text_frame

#?文本框样式调整
tf.margin_bottom?=?Cm(0.1)??#?下边距
tf.margin_left?=?0??#?左边距
tf.vertical_anchor?=?MSO_VERTICAL_ANCHOR.BOTTOM??#?垂直方式:底端对齐
tf.word_wrap?=?True??#?文本框的文字自动对齐
“
指定文本在文本框架中的垂直对齐方式。与TextFrame对象的.vertical_anchor属性一起使用。请注意,vertical_anchor属性也可以具有值None,表示没有直接指定的垂直锚设置,并且其有效值是从占位符继承的(如果有一个或从主题继承)。也可以不指定任何内容来删除明确指定的垂直锚设置。
from?pptx.enum.text?import?MSO_ANCHOR

cell?=?table.cell(row_idx=2,?col_idx=3)
cell.vertical_anchor?=?MSO_ANCHOR.BOTTOM
TOP Aligns text to top of text frame and inherits its value from its layout placeholder or theme. MIDDLE Centers text vertically BOTTOM Aligns text to bottom of text frame MIXED Return value only; indicates a combination of the other states.-
垂直对齐
-
-
设置文本框内容
#?设置内容 tf.paragraphs[0].text?=?'这是一段文本框里的文字' -
字体样式调整
#?字体样式调整
tf.paragraphs[0].alignment?=?PP_ALIGN.CENTER??#?对齐方式
tf.paragraphs[0].font.name?=?'微软雅黑'??#?字体名称
tf.paragraphs[0].font.bold?=?True??#?是否加粗
tf.paragraphs[0].font.italic?=?True??#?是否斜体
tf.paragraphs[0].font.color.rgb?=?RGBColor(255,?0,?0)??#?字体颜色
tf.paragraphs[0].font.size?=?Pt(20)??#?字体大小
from?pptx.enum.text?import?PP_ALIGN shape.paragraphs[0].alignment?=?PP_ALIGN.CENTER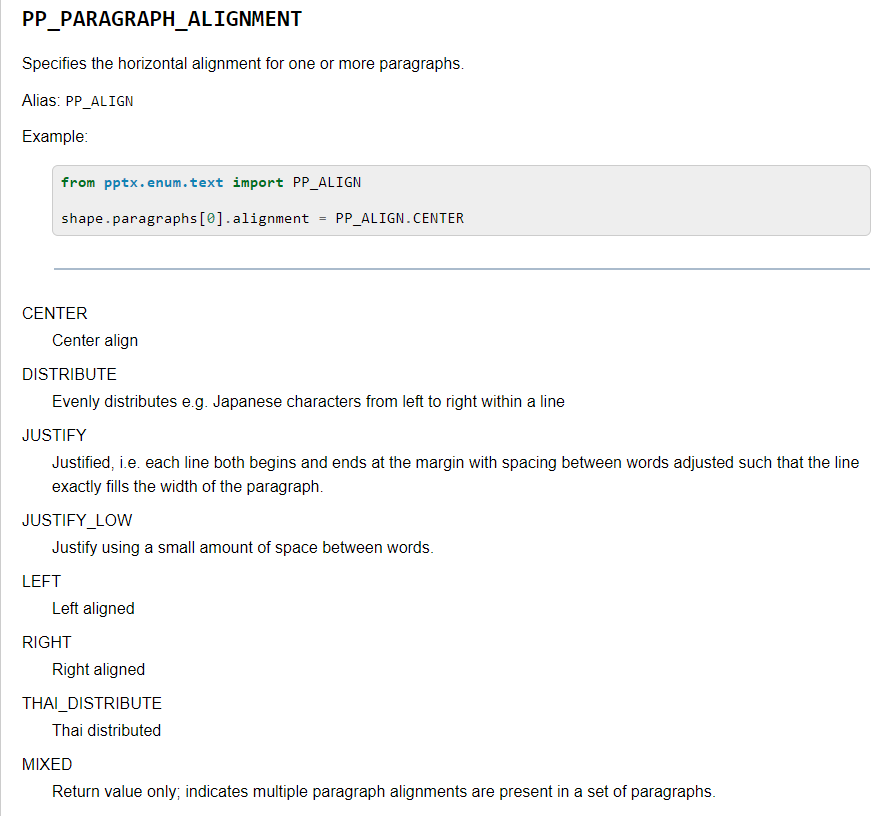
-
文字对齐
-
  CENTER
  	Center align
  DISTRIBUTE
  	Evenly distributes e.g. Japanese characters from left to right within a line
  JUSTIFY
  	Justified, i.e. each line both begins and ends at the margin with spacing between words adjusted such that the line exactly fills the width of the paragraph.
  JUSTIFY_LOW
  	Justify using a small amount of space between words.
  LEFT
  	Left aligned
  RIGHT
  	Right aligned
  THAI_DISTRIBUTE
  	Thai distributed
  MIXED
  	Return value only; indicates multiple paragraph alignments are present in a set of paragraphs.
-
保存ppt
??#?保存ppt
??ppt.save('4.1.2?设置文字框与字体样式.pptx')
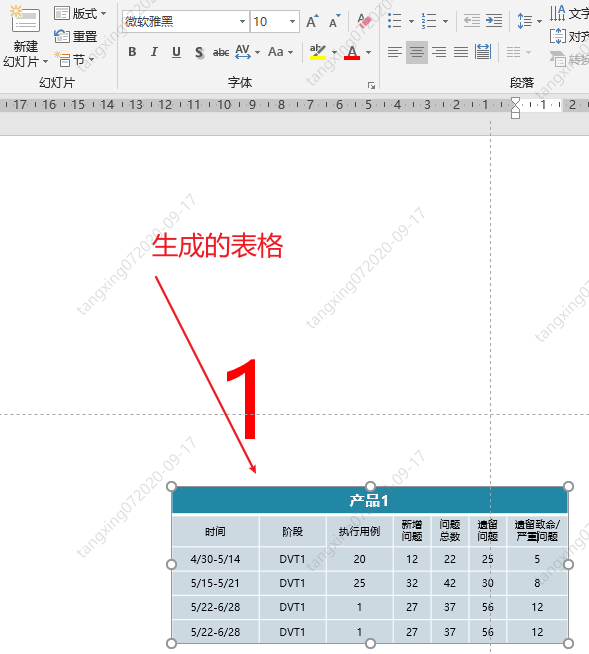
4.2 python-pptx 添加表格并设置样式
示例代码:
from?pptx?import?Presentation
from?pptx.util?import?Pt,Cm
from?pptx.dml.color?import?RGBColor
from?pptx.enum.text?import?MSO_ANCHOR
from?pptx.enum.text?import?PP_ALIGN


#?设置需要添加到哪一页
n_page?=?0

#?打开已存在ppt
ppt?=?Presentation('4.?python-pptx操作模板.pptx')

#?获取slide对象
slide?=?ppt.slides[n_page]

#?设置表格位置和大小
left,?top,?width,?height?=?Cm(6),?Cm(12),?Cm(13.6),?Cm(5)
#?表格行列数,和大小
shape?=?slide.shapes.add_table(6,?7,?left,?top,?width,?height)
#?获取table对象
table?=?shape.table

#?设置列宽
table.columns[0].width?=?Cm(3)
table.columns[1].width?=?Cm(2.3)
table.columns[2].width?=?Cm(2.3)
table.columns[3].width?=?Cm(1.3)
table.columns[4].width?=?Cm(1.3)
table.columns[5].width?=?Cm(1.3)
table.columns[6].width?=?Cm(2.1)

#?设置行高
table.rows[0].height?=?Cm(1)

#?合并首行
table.cell(0,?0).merge(table.cell(0,?6))

#?填写标题
table.cell(1,?0).text?=?"时间"
table.cell(1,?1).text?=?"阶段"
table.cell(1,?2).text?=?"执行用例"
table.cell(1,?3).text?=?"新增问题"
table.cell(1,?4).text?=?"问题总数"
table.cell(1,?5).text?=?"遗留问题"
table.cell(1,?6).text?=?"遗留致命/"?\
????????????????????????"严重问题"

#?填写变量内容
table.cell(0,?0).text?=?"产品1"
content_arr?=?[["4/30-5/14",?"DVT1",?"20",?"12",?"22",?"25",?"5"],
???????????????["5/15-5/21",?"DVT1",?"25",?"32",?"42",?"30",?"8"],
???????????????["5/22-6/28",?"DVT1",?"1",?"27",?"37",?"56",?"12"],
???????????????["5/22-6/28",?"DVT1",?"1",?"27",?"37",?"56",?"12"]]

#?修改表格样式
for?rows?in?range(6):
????for?cols?in?range(7):
????????#?Write?column?titles
????????if?rows?==?0:
????????????#?设置文字大小
????????????table.cell(rows,?cols).text_frame.paragraphs[0].font.size?=?Pt(15)
????????????#?设置字体
????????????table.cell(rows,?cols).text_frame.paragraphs[0].font.name?=?'微软雅黑'
????????????#?设置文字颜色
????????????table.cell(rows,?cols).text_frame.paragraphs[0].font.color.rgb?=?RGBColor(255,?255,?255)
????????????#?设置文字左右对齐
????????????table.cell(rows,?cols).text_frame.paragraphs[0].alignment?=?PP_ALIGN.CENTER
????????????#?设置文字上下对齐
????????????table.cell(rows,?cols).vertical_anchor?=?MSO_ANCHOR.MIDDLE
????????????#?设置背景为填充
????????????table.cell(rows,?cols).fill.solid()
????????????#?设置背景颜色
????????????table.cell(rows,?cols).fill.fore_color.rgb?=?RGBColor(34,?134,?165)
????????elif?rows?==?1:
????????????table.cell(rows,?cols).text_frame.paragraphs[0].font.size?=?Pt(10)
????????????table.cell(rows,?cols).text_frame.paragraphs[0].font.name?=?'微软雅黑'??#?字体名称
????????????table.cell(rows,?cols).text_frame.paragraphs[0].font.color.rgb?=?RGBColor(0,?0,?0)
????????????table.cell(rows,?cols).text_frame.paragraphs[0].alignment?=?PP_ALIGN.CENTER
????????????table.cell(rows,?cols).vertical_anchor?=?MSO_ANCHOR.MIDDLE
????????????table.cell(rows,?cols).fill.solid()
????????????table.cell(rows,?cols).fill.fore_color.rgb?=?RGBColor(204,?217,?225)
????????else:
????????????table.cell(rows,?cols).text?=?content_arr[rows?-?2][cols]
????????????table.cell(rows,?cols).text_frame.paragraphs[0].font.size?=?Pt(10)
????????????table.cell(rows,?cols).text_frame.paragraphs[0].font.name?=?'微软雅黑'??#?字体名称
????????????table.cell(rows,?cols).text_frame.paragraphs[0].font.color.rgb?=?RGBColor(0,?0,?0)
????????????table.cell(rows,?cols).text_frame.paragraphs[0].alignment?=?PP_ALIGN.CENTER
????????????table.cell(rows,?cols).vertical_anchor?=?MSO_ANCHOR.MIDDLE
????????????table.cell(rows,?cols).fill.solid()
????????????table.cell(rows,?cols).fill.fore_color.rgb?=?RGBColor(204,?217,?225)

ppt.save('4.2?python-pptx?添加表格并设置样式.pptx')
效果如下:
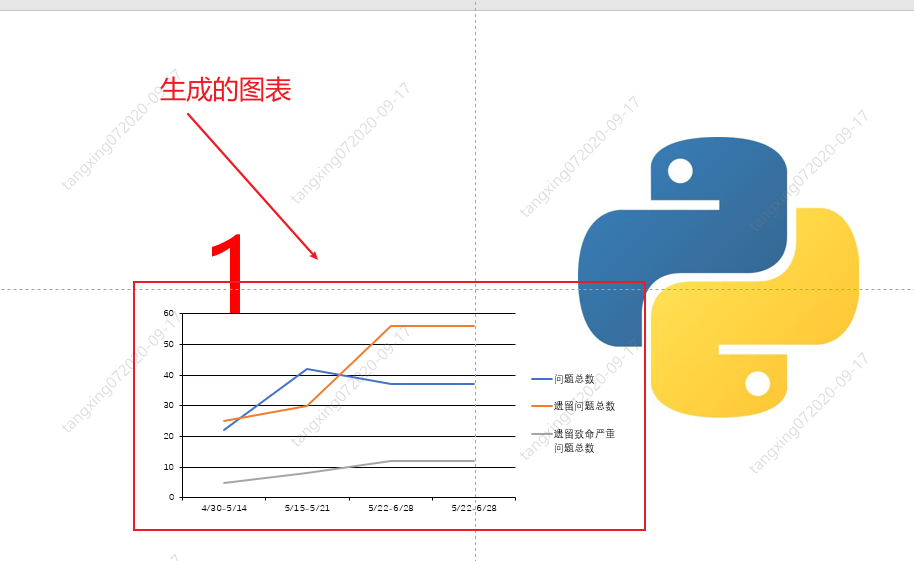
4.3 python-pptx 添加图表并设置样式
示例代码:
from?pptx?import?Presentation
from?pptx.util?import?Pt,Cm
from?pptx.chart.data?import?ChartData
from?pptx.enum.chart?import?XL_CHART_TYPE


#?设置需要添加到哪一页
n_page?=?0

#?打开已存在ppt
ppt?=?Presentation('4.?python-pptx操作模板.pptx')

#?获取slide对象
slide?=?ppt.slides[n_page]

#?初始化图表
chart_data?=?ChartData()

#?填充需要添加的内容
content_arr?=?[["4/30-5/14",?"DVT1",?"20",?"12",?"22",?"25",?"5"],
???????????????["5/15-5/21",?"DVT1",?"25",?"32",?"42",?"30",?"8"],
???????????????["5/22-6/28",?"DVT1",?"1",?"27",?"37",?"56",?"12"],
???????????????["5/22-6/28",?"DVT1",?"1",?"27",?"37",?"56",?"12"]]

#?填充图表
chart_data.categories?=?[content_arr[0][0],?content_arr[1][0],?content_arr[2][0],?content_arr[3][0]]
chart_data.add_series("问题总数",?(content_arr[0][4],?content_arr[1][4],?content_arr[2][4],?content_arr[3][4]))
chart_data.add_series("遗留问题总数",?(content_arr[0][5],?content_arr[1][5],?content_arr[2][5],?content_arr[3][5]))
chart_data.add_series("遗留致命严重\n问题总数",?(content_arr[0][6],?content_arr[1][6],?content_arr[2][6],?content_arr[3][6]))

#?设置位置
left,?top,?width,?height?=?Cm(6),?Cm(10),?Cm(16.1),?Cm(7.5)
#?添加图表
chart?=?slide.shapes.add_chart(
????XL_CHART_TYPE.LINE,?left,?top,?width,?height,?chart_data
).chart


chart.has_legend?=?True
chart.legend.include_in_layout?=?False
#?chart.series[0].smooth?=?True?#?是否平滑
#?chart.series[1].smooth?=?True
#?chart.series[2].smooth?=?True
chart.font.size?=?Pt(10)??#?文字大小

ppt.save('4.3?python-pptx?添加图表并设置样式.pptx')
print('折线图添加完成')
效果如下:
其它图表可参考:https://www.cnblogs.com/adam012019/p/11348938.html
4.4 python-pptx 添加形状并设置样式
这里的形状可以是这些:
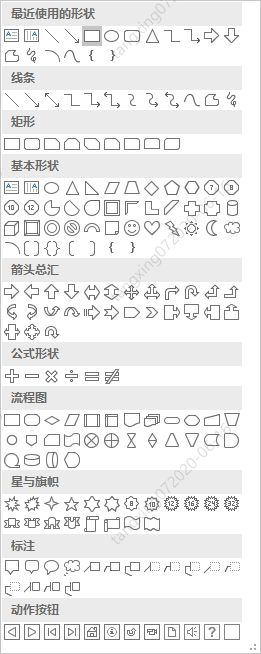
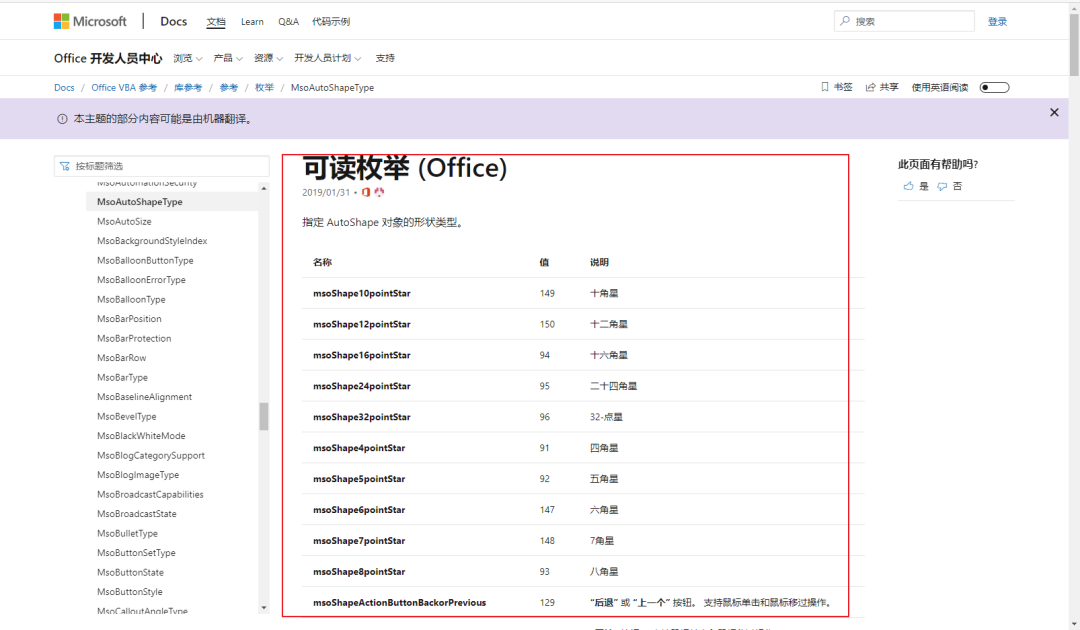
形状别名可以再这里查看:
https://docs.microsoft.com/zh-cn/office/vba/api/Office.MsoAutoShapeType
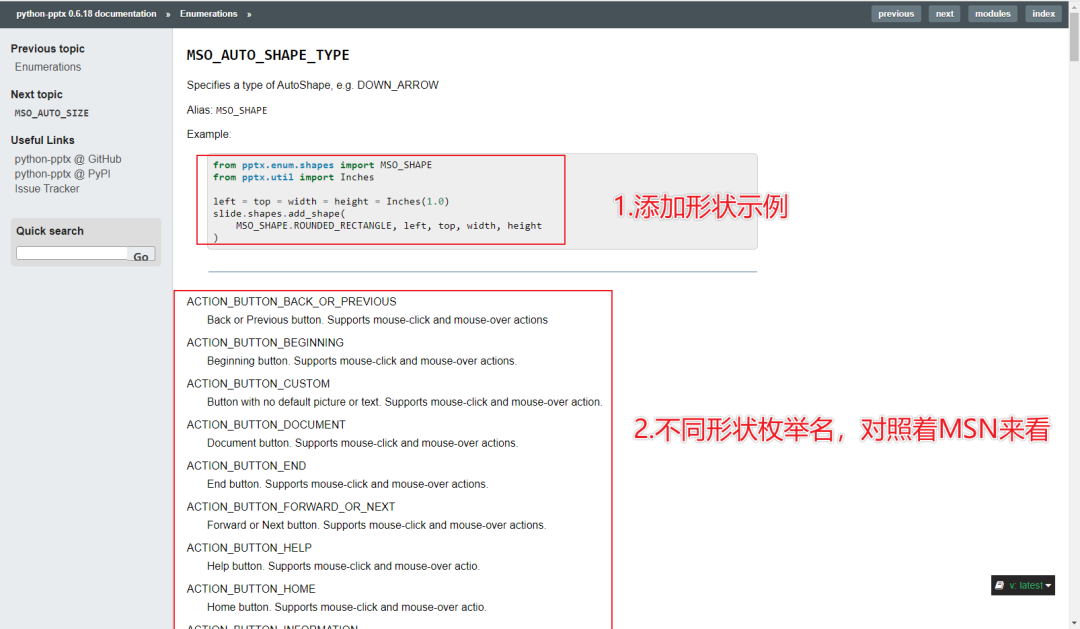
并对应这里,找到正确的枚举名:
https://python-pptx.readthedocs.io/en/latest/api/enum/MsoAutoShapeType.html#msoautoshapetype
程序示例:
from?pptx?import?Presentation
from?pptx.util?import?Pt,Cm
from?pptx.dml.color?import?RGBColor
from?pptx.enum.text?import?PP_ALIGN
from?pptx.enum.shapes?import?MSO_SHAPE


#?设置需要添加到哪一页
n_page?=?0

#?打开已存在ppt
ppt?=?Presentation('4.?python-pptx操作模板.pptx')

#?获取slide对象
slide?=?ppt.slides[n_page]

#?添加矩形
#?设置位置以及大小
left,?top,?width,?height?=?Cm(2.5),?Cm(4.5),?Cm(30),?Cm(0.5)
#?添加形状
rectangle?=?slide.shapes.add_shape(MSO_SHAPE.RECTANGLE,?left,?top,?width,?height)
#?设置背景填充
rectangle.fill.solid()
#?设置背景颜色
rectangle.fill.fore_color.rgb?=?RGBColor(34,?134,?165)
#?设置边框颜色
rectangle.line.color.rgb?=?RGBColor(34,?134,?165)

#?添加正三角+文字(正常)
left,?top,?width,?height?=?Cm(3),?Cm(5.1),?Cm(0.5),?Cm(0.4)
slide.shapes.add_shape(MSO_SHAPE.FLOWCHART_EXTRACT,?left,?top,?width,?height)
new_paragraph?=?slide.shapes.add_textbox(left=left?-?Cm(0.95),?top=top?+?Cm(0.4),?width=Cm(2.4),height=Cm(1.1)).text_frame
content?=?"""2020/01/05
内容1"""
new_paragraph.paragraphs[0].text?=?content
new_paragraph.paragraphs[0].font.size?=?Pt(10)??#?文字大小
new_paragraph.paragraphs[0].alignment?=?PP_ALIGN.CENTER

#?添加正三角+文字(延期)
left,?top,?width,?height?=?Cm(9),?Cm(5.1),?Cm(0.5),?Cm(0.4)
extract?=?slide.shapes.add_shape(MSO_SHAPE.FLOWCHART_EXTRACT,?left,?top,?width,?height)
extract.fill.solid()
extract.fill.fore_color.rgb?=?RGBColor(255,?0,?0)
extract.line.color.rgb?=?RGBColor(255,?0,?0)

new_paragraph?=?slide.shapes.add_textbox(left=left?-?Cm(0.95),?top=top?+?Cm(0.4),?width=Cm(2.4),height=Cm(1.1)).text_frame
content?=?"""2020/01/05
内容2"""
new_paragraph.paragraphs[0].text?=?content??#?文字内容
new_paragraph.paragraphs[0].font.size?=?Pt(10)??#?文字大小
new_paragraph.paragraphs[0].font.color.rgb?=?RGBColor(255,?0,?0)????#?文字颜色
new_paragraph.paragraphs[0].alignment?=?PP_ALIGN.CENTER?#?文字水平对齐方式

#?添加倒三角+间隔条+文字
left,?top,?width,?height?=?Cm(5),?Cm(4),?Cm(0.5),?Cm(0.4)
slide.shapes.add_shape(MSO_SHAPE.FLOWCHART_MERGE,?left,?top,?width,?height)
gap?=?slide.shapes.add_shape(MSO_SHAPE.RECTANGLE,?left?+?Cm(0.2),?top?+?Cm(0.5),?Cm(0.05),?Cm(0.5))
gap.fill.solid()
gap.fill.fore_color.rgb?=?RGBColor(255,?255,?255)
gap.line.color.rgb?=?RGBColor(255,?255,?255)

new_paragraph?=?slide.shapes.add_textbox(left=left?-?Cm(0.95),?top=top?-?Cm(1),?width=Cm(2.4),height=Cm(1.1)).text_frame
content?=?"""2020/01/05
内容3"""
new_paragraph.paragraphs[0].text?=?content
new_paragraph.paragraphs[0].font.size?=?Pt(10)??#?文字大小
new_paragraph.paragraphs[0].alignment?=?PP_ALIGN.CENTER

#?添加当前时间图形
left,?top,?width,?height?=?Cm(7),?Cm(4),?Cm(0.5),?Cm(0.4)
now?=?slide.shapes.add_shape(MSO_SHAPE.DOWN_ARROW,?left,?top,?width,?height)
now.fill.solid()
now.fill.fore_color.rgb?=?RGBColor(254,?152,?47)
now.line.color.rgb?=?RGBColor(254,?152,?47)

ppt.save('4.4?python-pptx?添加形状并设置样式.pptx')
print('进度条添加完成')
效果如下:

5.seaborn绘图库介绍与使用
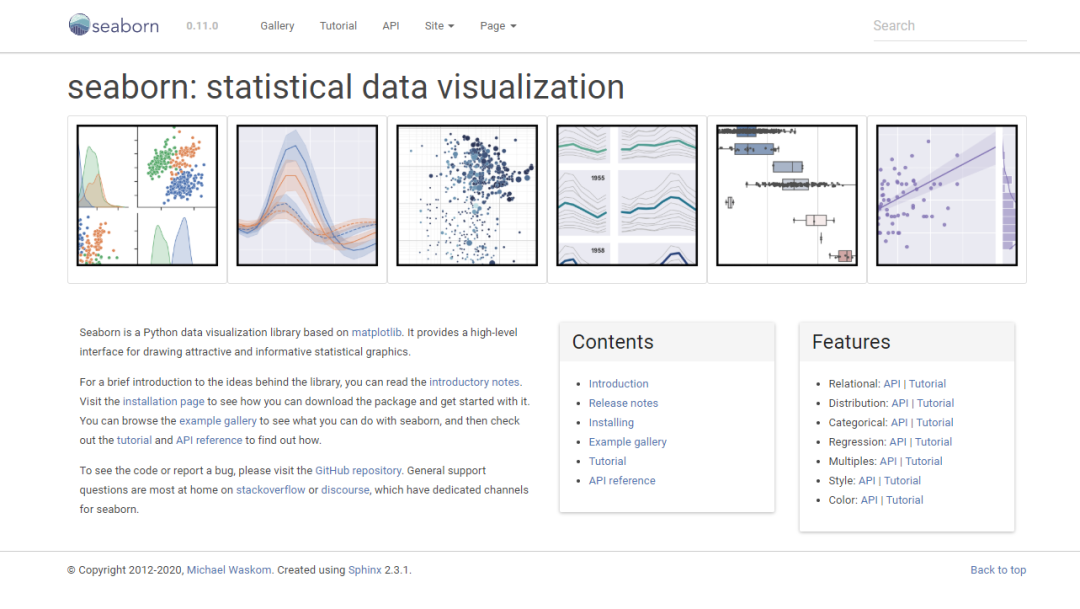
官方网址:http://seaborn.pydata.org/
-
seaborn是基于Matplotlib的Python数据可视化库。它提供了一个高级界面,用于绘制引人入胜且内容丰富的统计图形
-
只是在Matplotlib上进行了更高级的API封装,从而使作图更加容易
-
seaborn是针对统计绘图的,能满足数据分析90%的绘图需求,需要复杂的自定义图形还需要使用到Matplotlib
5.1 pip安装seaborn
pip?install?seaborn
效果如下(我的显示已安装):

使用:
import?seaborn?as?sns?
#?或者
import?seaborn
使用数据集:
import?seaborn?as?sns

tips?=?sns.load_dataset("tips")
无法连接:

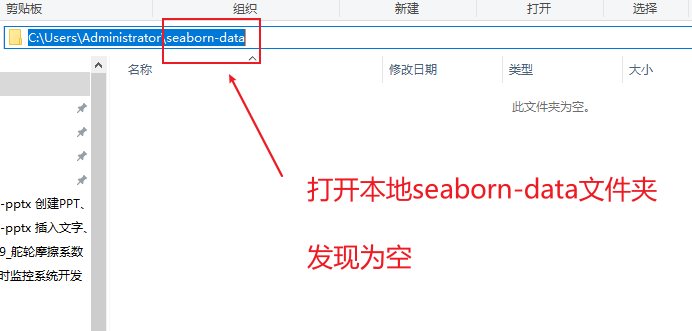
下载数据集:
https://github.com/mwaskom/seaborn-data
放到本地:
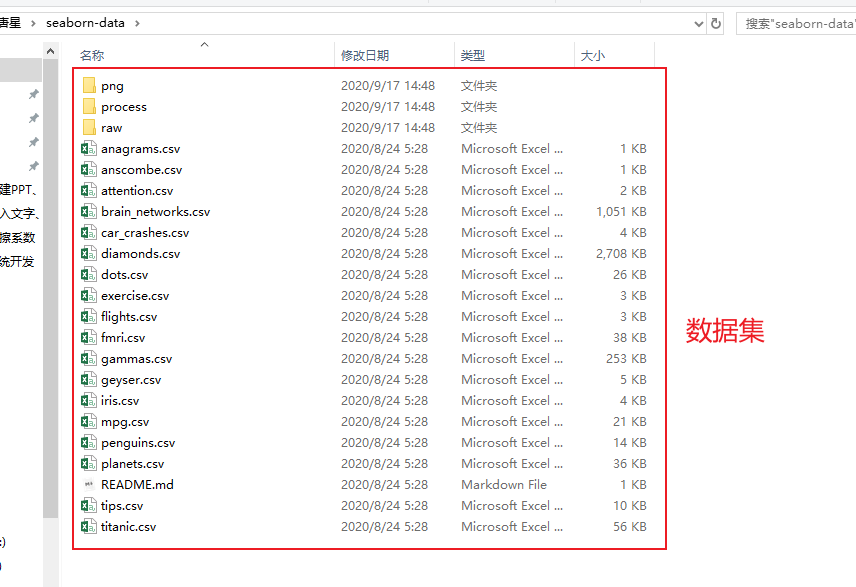
运行程序:
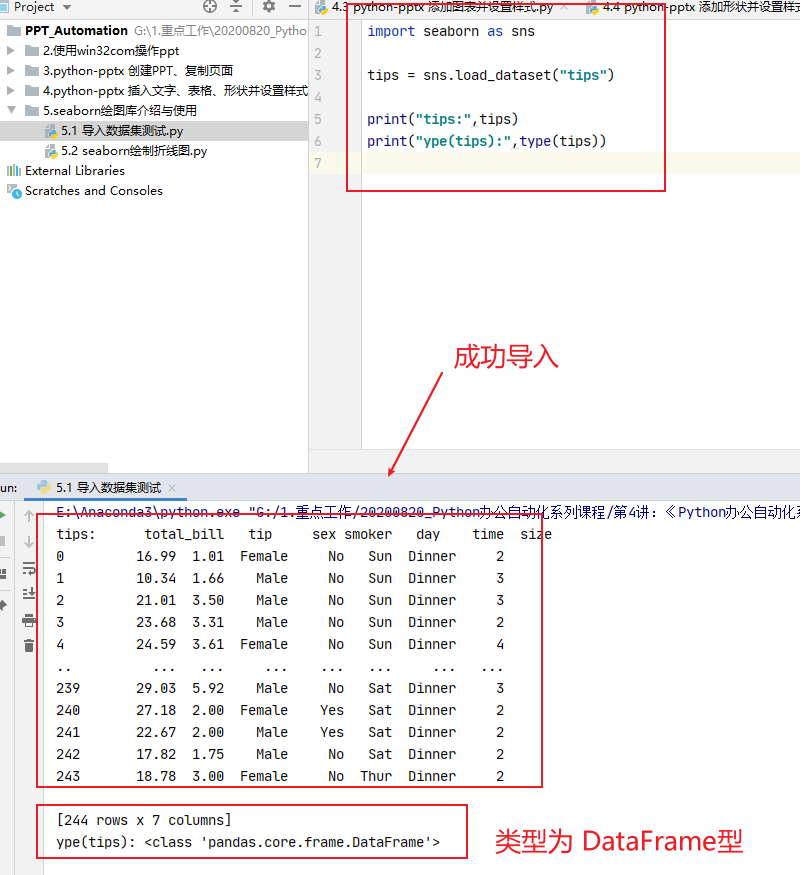
import?seaborn?as?sns

tips?=?sns.load_dataset("tips")

print("tips:",tips)
print("ype(tips):",type(tips))
效果如下:
参考博客:
《解决seaborn导入数据集出现错误》
https://blog.csdn.net/qq_33828738/article/details/107044082
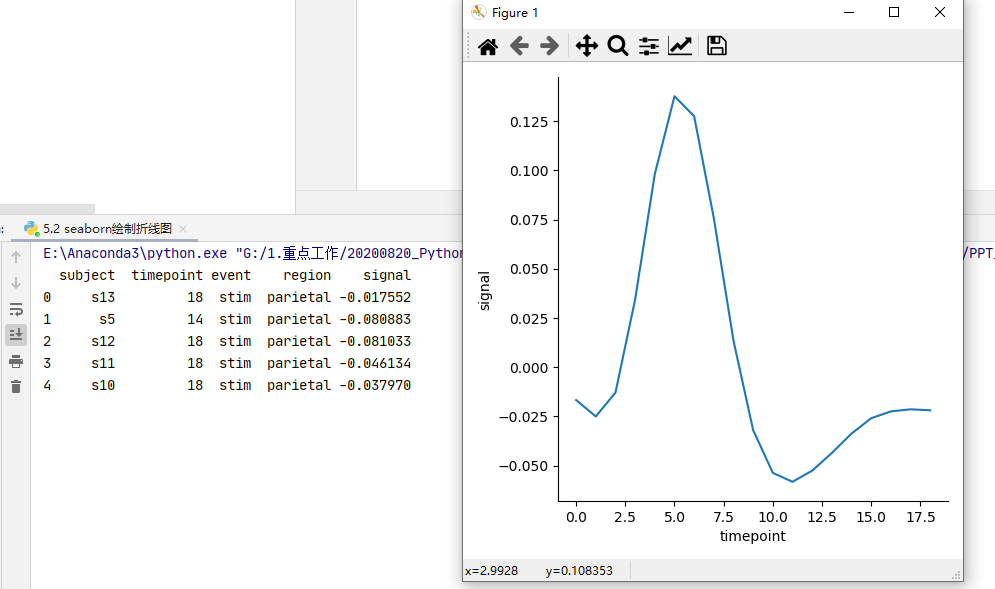
5.2 seaborn绘制折线图
5.2.1 通过relplot来实现
示例代码:
import?matplotlib.pyplot?as?plt
import?seaborn?as?sns

#?数据集
data?=?sns.load_dataset("fmri")
print(data.head())
#?绘画折线图
sns.relplot(x="timepoint",?y="signal",?kind="line",?data=data,?ci=None)
#?显示
plt.show()
效果如下:
5.2.2 通过lineplot()函数来实现
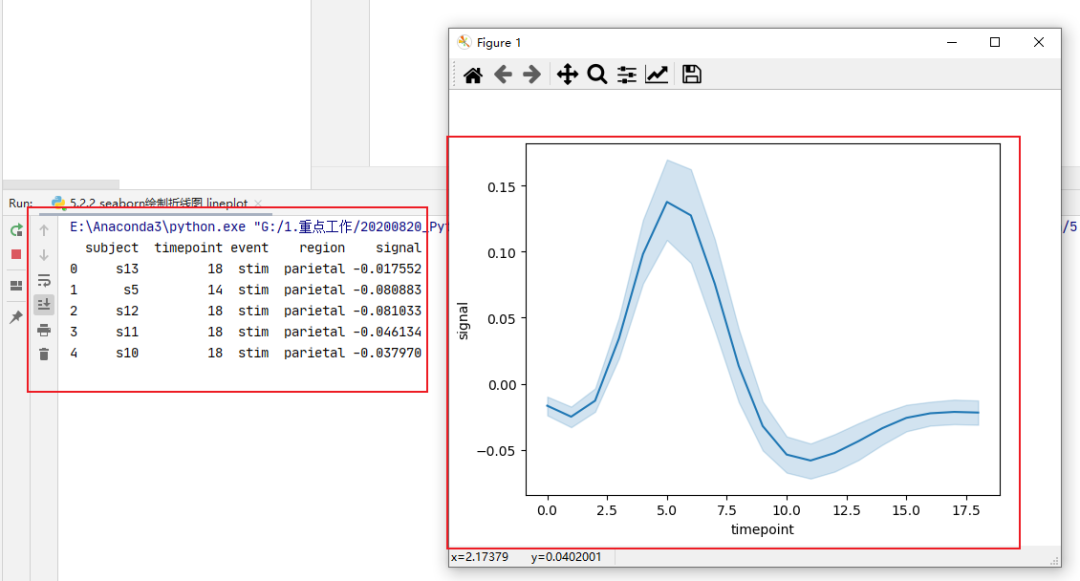
示例代码:
import?matplotlib.pyplot?as?plt
import?seaborn?as?sns

#?数据集
data?=?sns.load_dataset("fmri")
print(data.head())
#?绘画折线图:
sns.lineplot(x="timepoint",?y="signal",?data=data,?ci=95)
#?显示
plt.show()
效果如下:
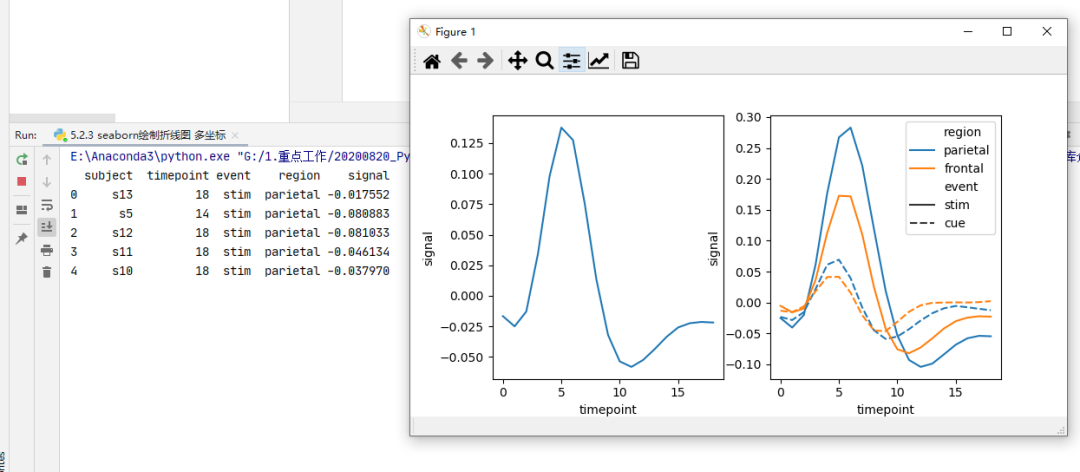
5.2.3 多坐标效果
示例代码:
import?matplotlib.pyplot?as?plt
import?seaborn?as?sns

#?数据集
data?=?sns.load_dataset("fmri")
print(data.head())

#?绘画折线图
f,?axes?=?plt.subplots(nrows=1,?ncols=2,?figsize=(14,?6))

sns.lineplot(x="timepoint",?y="signal",?data=data,?ci=None,?ax=axes[0])
sns.lineplot(x="timepoint",?y="signal",?hue="region",?style="event",?data=data,?ci=None,?ax=axes[1])
plt.show()
效果如下:
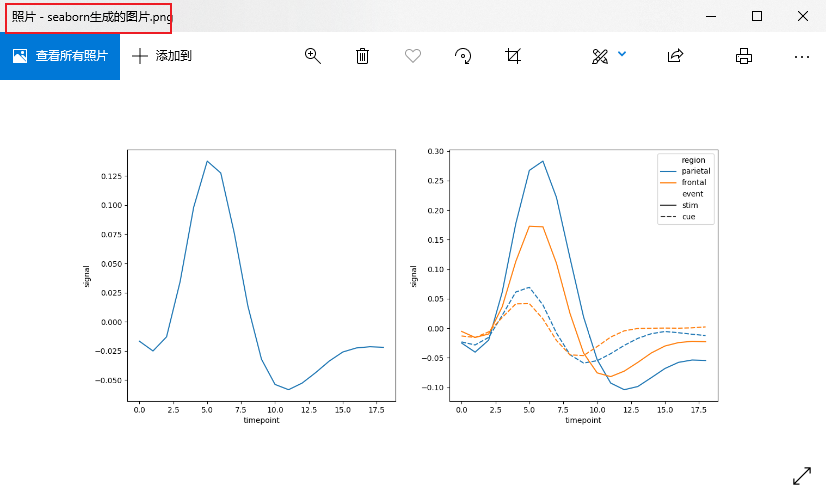
5.2.4 保存生成的图片
注意:需要在plt.show()之前调用savefig,不然保存的图片就是一片空白
plt.savefig('seaborn生成的图片.png')

plt.show()
效果如下:

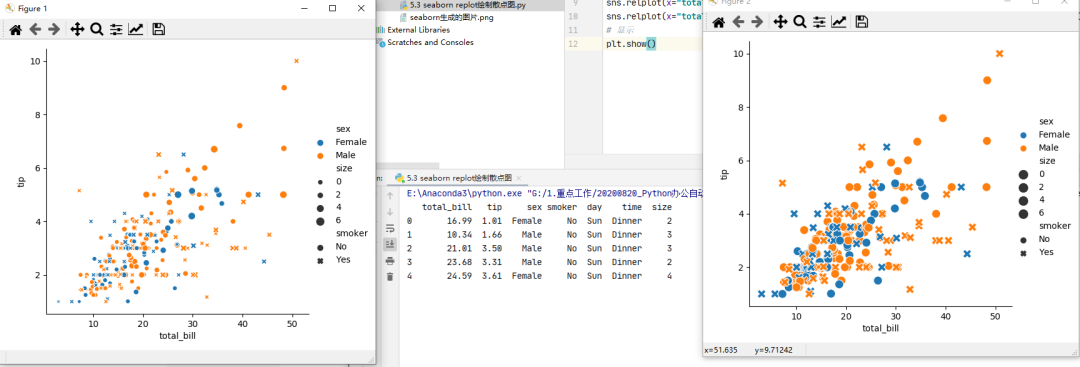
5.3 seaborn replot 绘制散点图

示例代码:
import?matplotlib.pyplot?as?plt
import?seaborn?as?sns

#?准备数据:自带数据集
tips?=?sns.load_dataset("tips")
print(tips.head())

#?绘画散点图
sns.relplot(x="total_bill",?y="tip",?data=tips,?hue="sex",?style="smoker",?size="size")
sns.relplot(x="total_bill",?y="tip",?data=tips,?hue="sex",?style="smoker",?size="size",?sizes=(100,?100))
#?显示
plt.show()
效果如下:
5.4 seaborn barplot绘制柱状图
-
垂直
示例代码:
import?matplotlib.pyplot?as?plt
import?seaborn?as?sns

#?显示正负号与中文不显示问题
plt.rcParams['axes.unicode_minus']?=?False
sns.set_style('darkgrid',?{'font.sans-serif':['SimHei',?'Arial']})

#?去除部分warning
import?warnings
warnings.filterwarnings('ignore')

plt.figure(dpi=150)
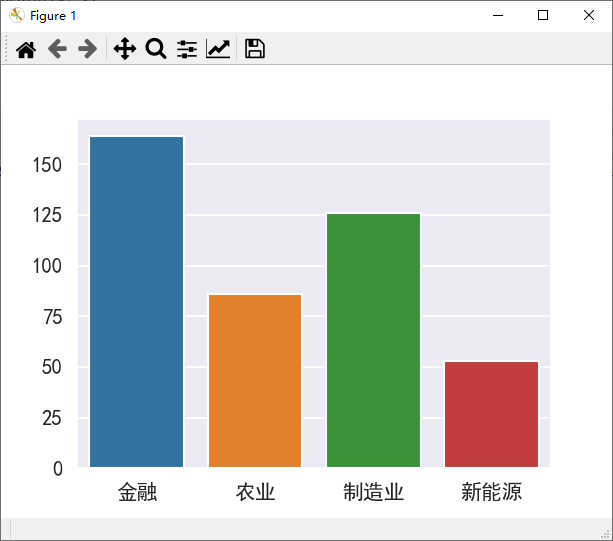
x?=?['金融','农业','制造业','新能源']
y?=?[164,?86,?126,?53]
sns.barplot(x,?y)

plt.show()
效果如下:
-
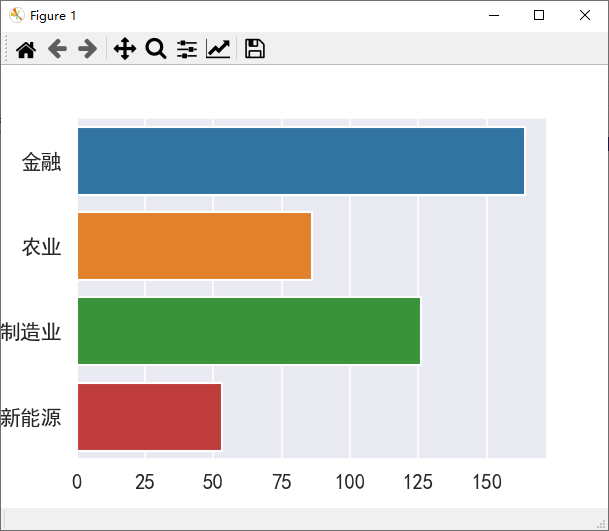
水平
调换横纵坐标位置即可
plt.figure(dpi=150)
x?=?['金融','农业','制造业','新能源']
y?=?[164,?86,?126,?53]
sns.barplot(y,x?)
plt.show()
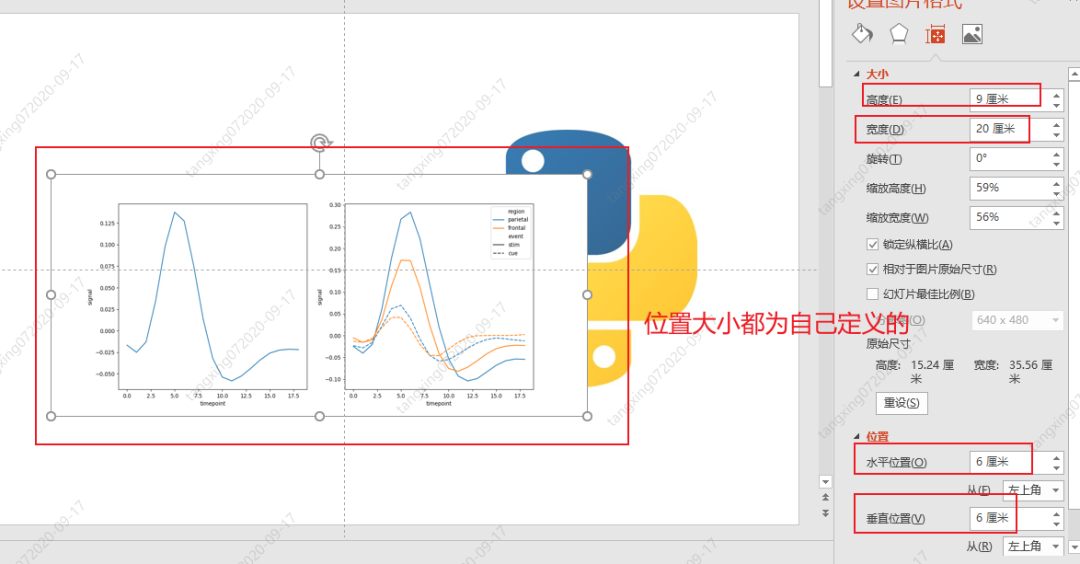
6.python-pptx 插入图片
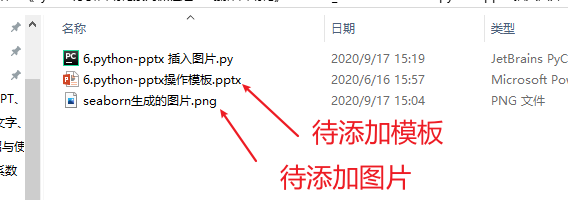
前提条件:
示例代码:
from?pptx?import?Presentation
from?pptx.util?import?Pt,Cm

#?打开已存在ppt
ppt?=?Presentation('6.python-pptx操作模板.pptx')

#?设置添加到当前ppt哪一页
n_page?=?0

#?获取需要添加文字的页面对象
slide?=?ppt.slides[n_page]

#?设置待添加的图片
img_name??=?'seaborn生成的图片.png'
#?设置位置
left,?top,?width,?height?=?Cm(6),?Cm(6),?Cm(20),?Cm(9)
#?进行添加
slide.shapes.add_picture(image_file=img_name,left=left,top=top,width=width,height=height)

#?保存ppt
ppt.save('6.python-pptx?插入图片.pptx')
效果如下:

7.python-pptx 读取数据
前提条件:
准备好一张有内容的ppt

示例代码:
from?pptx?import?Presentation
from?pptx.enum.shapes?import?MSO_SHAPE_TYPE

#?打开待读取的ppt文件
ppt?=?Presentation('研发管理部检测部周报2020-09-17.pptx')

#?获取第0张
slide0?=?ppt.slides[0]

#?遍历所有内容
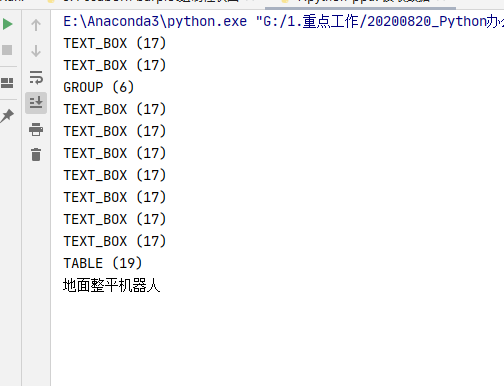
for?shape?in?slide0.shapes:
????#?打印shape名称
????print(shape.shape_type)
????#?判断是否为表格
????if?shape.shape_type?==?MSO_SHAPE_TYPE.TABLE:
????????#获取表格行
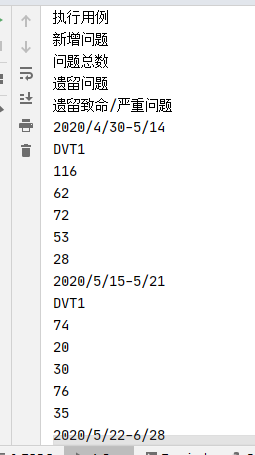
????????for?row?in?shape.table.rows:
????????????for?cell?in?row.cells:
????????????????print(cell.text_frame.text)
效果如下:
将当前幻灯片页面中的对象名称和表格内容全部打印出来了,反之,我们对其进行复制,就是写操作。
本文来自互联网用户投稿,该文观点仅代表作者本人,不代表本站立场。本站仅提供信息存储空间服务,不拥有所有权,不承担相关法律责任。 如若内容造成侵权/违法违规/事实不符,请联系我的编程经验分享网邮箱:veading@qq.com进行投诉反馈,一经查实,立即删除!