CEC2017(Python):五种算法(DBO、HHO、RFO、SSA、PSO)求解CEC2017
2024-01-07 21:00:29
一、5种算法简介
1、蜣螂优化算法DBO
2、哈里斯鹰优化算法HHO
3、红狐优化算法RFO
4、麻雀搜索算法SSA
5、粒子群优化算法PSO
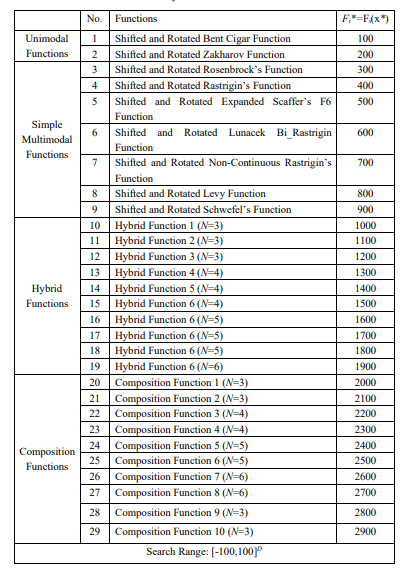
二、CEC2017简介
参考文献:
[1]Awad, N. H., Ali, M. Z., Liang, J. J., Qu, B. Y., & Suganthan, P. N. (2016). “Problem definitions and evaluation criteria for the CEC2017 special session and competition on single objective real-parameter numerical optimization,” Technical Report. Nanyang Technological University, Singapore.
三、5种算法求解CEC2017
(1)部分Python代码
import cec2017.functions as functions
import numpy as np
import matplotlib.pyplot as plt
from SSA import SSA
from RFO import RFO
from DBO import DBO
from PSO import PSO
from HHO import HHO


plt.rcParams['font.sans-serif']=['Microsoft YaHei']
#主程序
function_name =1 #CEC2017 测试函数 1-29
SearchAgents_no = 50#种群大小
Max_iter = 100#最大迭代次数
dim=30;#维度只能是 10/30/50/100
lb = -100*np.ones(dim)#下界
ub = 100*np.ones(dim)#上界
fobj= functions.all_functions[function_name-1]


BestX1,BestF1,curve1 = SSA(SearchAgents_no, Max_iter,lb,ub,dim,fobj)#问题求解
BestX2,BestF2,curve2 = RFO(SearchAgents_no, Max_iter,lb,ub,dim,fobj)#问题求解
BestX3,BestF3,curve3 = DBO(SearchAgents_no, Max_iter,lb,ub,dim,fobj)#问题求解
BestX4,BestF4,curve4 = PSO(SearchAgents_no, Max_iter,lb,ub,dim,fobj)#问题求解
BestX5,BestF5,curve5 = HHO(SearchAgents_no, Max_iter,lb,ub,dim,fobj)#问题求解
#画收敛曲线图
Labelstr=['SSA','RFO','DBO','PSO','HHO']
Colorstr=['r','g','b','k','c']
if BestF1>0:
? ? plt.semilogy(curve1,color=Colorstr[0],linewidth=2,label=Labelstr[0])
? ? plt.semilogy(curve2,color=Colorstr[1],linewidth=2,label=Labelstr[1])
? ? plt.semilogy(curve3,color=Colorstr[2],linewidth=2,label=Labelstr[2])
? ? plt.semilogy(curve4,color=Colorstr[3],linewidth=2,label=Labelstr[3])
? ? plt.semilogy(curve5,color=Colorstr[4],linewidth=2,label=Labelstr[4])
else:
? ? plt.plot(curve1,color=Colorstr[0],linewidth=2,label=Labelstr[0])
? ? plt.plot(curve2,color=Colorstr[1],linewidth=2,label=Labelstr[1])
? ? plt.plot(curve3,color=Colorstr[2],linewidth=2,label=Labelstr[2])
? ? plt.plot(curve4,color=Colorstr[3],linewidth=2,label=Labelstr[3])
? ? plt.plot(curve5,color=Colorstr[4],linewidth=2,label=Labelstr[4])


plt.xlabel("Iteration")
plt.ylabel("Fitness")
plt.xlim(0,Max_iter)
plt.title("CEC2017-F"+str(function_name))
plt.legend()
plt.savefig(str(function_name)+'.png')
plt.show()
#

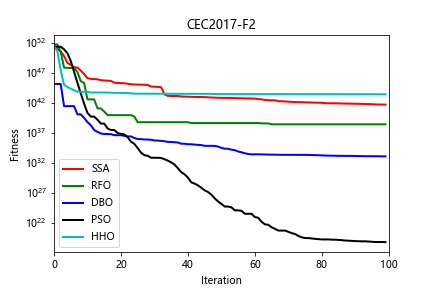
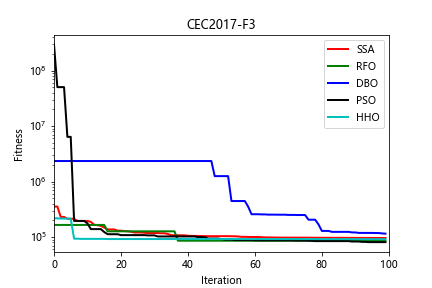
(2)部分结果


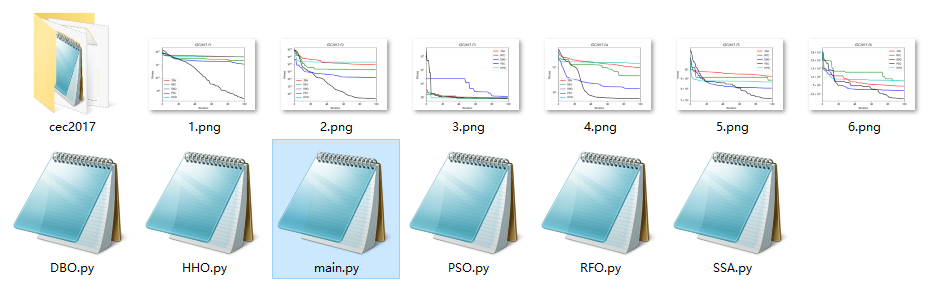
四、完整Python代码
文章来源:https://blog.csdn.net/weixin_46204734/article/details/135371933
本文来自互联网用户投稿,该文观点仅代表作者本人,不代表本站立场。本站仅提供信息存储空间服务,不拥有所有权,不承担相关法律责任。 如若内容造成侵权/违法违规/事实不符,请联系我的编程经验分享网邮箱:veading@qq.com进行投诉反馈,一经查实,立即删除!
本文来自互联网用户投稿,该文观点仅代表作者本人,不代表本站立场。本站仅提供信息存储空间服务,不拥有所有权,不承担相关法律责任。 如若内容造成侵权/违法违规/事实不符,请联系我的编程经验分享网邮箱:veading@qq.com进行投诉反馈,一经查实,立即删除!