目标跟踪 MOT数据集和可视化
2023-12-18 00:29:02
目录
MOT15数据集格式简介
以下内容转自:【目标跟踪】MOT数据集GroundTruth可视化-腾讯云开发者社区-腾讯云
MOT15数据集下载:https://pan.baidu.com/s/1foGrBXvsanW8BI4eybqfWg?pwd=8888
以下为一行gt示例:
1,1,1367,393,73,225,1,-1,-1,-1
各列数据对应含义如下
<frame>,<id>,<bb_left>,<bb_top>,<bb_width>,<bb_height>,<conf>,<x>,<y>,<z>复制
- frame:图片帧id
- id:目标id
- bb_left:bbox左上角坐标x
- bb_top:bbox左上角坐标y
- bb_width:bbox的宽度
- bb_height:bbox的高度
- conf:置信度
- x:三维坐标系x值,对于二维任务填充为-1
- y:三维坐标系y值,对于二维任务填充为-1
- z:三维坐标系z值,对于二维任务填充为-1
gt可视化
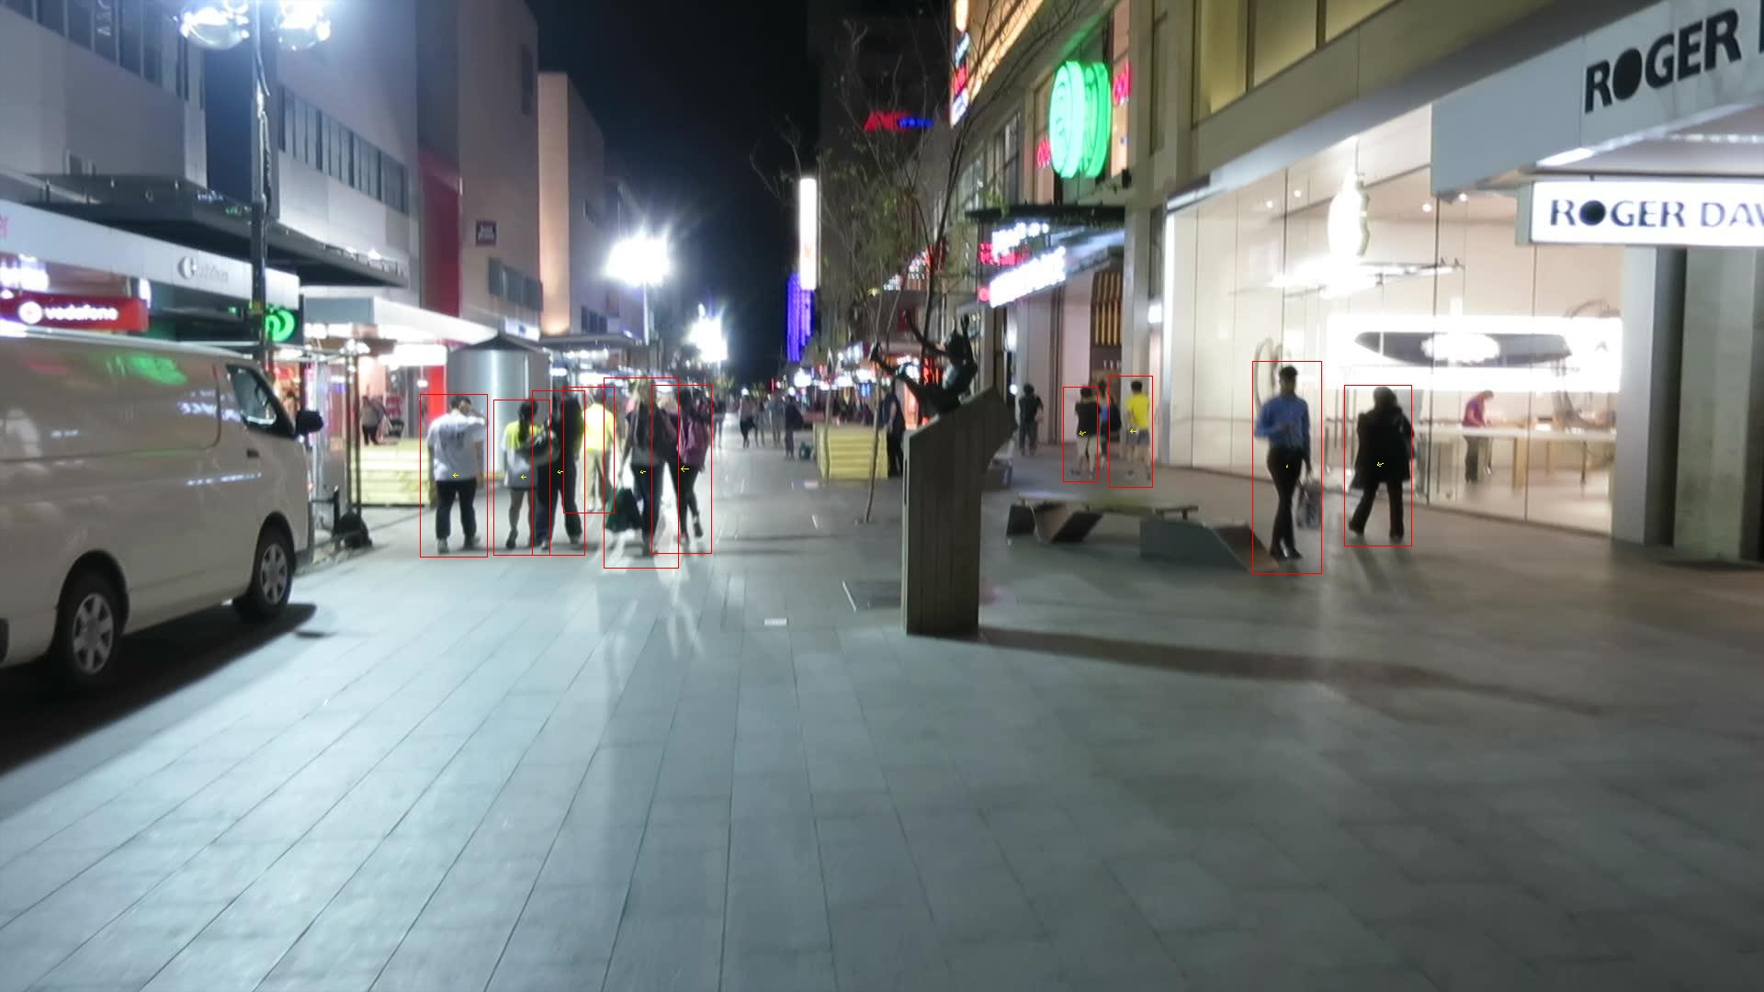
由于是跟踪任务,因此在可视化检测框的同时进一步添加箭头,用来标识目标的运动轨迹。
处理思路是读取一张图片后,同时读取两张图片的gt,若两张图片同时包含同一个目标,则用箭头连接前一帧bbox的中心点和后一帧bbox的中心点。
具体代码如下:
import cv2


def match_obj(obj_list, obj_id):
    try:
        index = obj_list.index(obj_id)
    except:
        index = -1
    return index


def main(i):
    img = cv2.imread("img/" + "0000{:0>2d}.jpg".format(i))
    img2 = img
    with open('gt/gt.txt', 'r') as f:
        lines = f.readlines()
        object_list = []
        center_list = []
        for line in lines:
            img_id = line.split(',')[0]
            if img_id == str(i):
                object_id = line.split(',')[1]
                object_list.append(object_id)
                x, y, w, h = int(line.split(',')[2]), int(line.split(',')[3]), int(line.split(',')[4]), int(
                    line.split(',')[5])
                center1 = (int(int(x) + int(w) / 2), int(int(y) + int(h) / 2))
                center_list.append(center1)
            if img_id == str(int(i) + 1):
                object_id = line.split(',')[1]
                index = match_obj(object_list, object_id)
                x, y, w, h = int(line.split(',')[2]), int(line.split(',')[3]), int(line.split(',')[4]), int(
                    line.split(',')[5])
                center2 = (int(int(x) + int(w) / 2), int(int(y) + int(h) / 2))
                if index != -1:
                    img2 = cv2.rectangle(img, (x, y), (x + w, y + h), (0, 0, 255))
                    img2 = cv2.arrowedLine(img2, center_list[index], center2, (0, 255, 255), 1, 8, 0, 0.5)

    cv2.imwrite("result/" + "0000{:0>2d}.jpg".format(i), img2)


if __name__ == '__main__':
    for i in range(1, 52):
        main(i)
复制
可视化效果如图所示:

在这里插入图片描述
文章来源:https://blog.csdn.net/jacke121/article/details/135051818
本文来自互联网用户投稿,该文观点仅代表作者本人,不代表本站立场。本站仅提供信息存储空间服务,不拥有所有权,不承担相关法律责任。 如若内容造成侵权/违法违规/事实不符,请联系我的编程经验分享网邮箱:veading@qq.com进行投诉反馈,一经查实,立即删除!
本文来自互联网用户投稿,该文观点仅代表作者本人,不代表本站立场。本站仅提供信息存储空间服务,不拥有所有权,不承担相关法律责任。 如若内容造成侵权/违法违规/事实不符,请联系我的编程经验分享网邮箱:veading@qq.com进行投诉反馈,一经查实,立即删除!