R语言对医学中的自然语言(NLP)进行机器学习处理(1)
什么是自然语言(NLP),就是网络中的一些书面文本。对于医疗方面,例如医疗记录、病人反馈、医生业绩评估和社交媒体评论,可以成为帮助临床决策和提高质量的丰富数据来源。如互联网上有基于文本的数据(例如,对医疗保健提供者的社交媒体评论),这些数据我们可以直接下载,有些可以通过爬虫抓取。例如:在病人论坛上发表对疾病或药物的评论,可以将它们存储在数据库中,然后进行分析。

在这个之前需要了解什么是情绪分析,情绪分析是指赋予词语、短语或其他文本单位主观意义的过程。情绪可以简单地分为正面或负面,也可以与更详细的主题有关,比如某些词语所反映的情绪。简单来说就是从语言从提取患者态度或者情绪的词语,然后进行分析,比如患者对这个药物的疗效,她说好,有用,我们提取出这些关键词来进行分析。
自然语言(NLP)进行机器学习分为无监督学习和有监督学习,本期咱们先来介绍无监督学习。咱们先导入R包和数据
library(tm)
library(data.table)
library(tidytext)
library(dplyr)
library(tidyr)
library(topicmodels)
library(performanceEstimation)
library(rsample)
library(recipes)
library(parsnip)
library(workflows)
library(tune)
library(dials)
library(kernlab)
library(ggplot2)
training_data <- as.data.frame(fread("E:/r/test/drugsComTrain_raw.tsv"))
咱们先来看一下数据

这是一个患者对药物评价的数据,该数据集提供了患者对特定药物及相关疾病的评估,以及10星级患者评级,反映了整体患者满意度。这些数据是通过爬取在线医药评论网站获得的。公众号回复:药物评论数据,可以获得该数据,我们先来看一下数据的构成,drugName:药物名称,condition (categorical)条件类别,多指患者的一些疾病类别,review:患者对药物的评论,rating患者对药物的打分,date (date)患者评论的日期,usefulCount发现评论有用的数据,代表浏览者支持这个观点。
这个数据有16万行,非常大,为了演示方便,我们只取5000个来演示
set.seed(123)
sample <- sample(nrow(training_data),5000)
data <- training_data[sample,]
dim(data)

因为这是网页抓取的数据,会存在一些乱码,所以咱们在分析前先要进行数据的清洗,编写一个简单的数据清洗程序,就是一些简单的正则式小知识
cleanText <- function(rawtext) {
rawtext <- gsub("'", "?", rawtext)
# Expand contractions
rawtext <- gsub("n?t", " not", rawtext)
rawtext <- gsub("won?t", "will not", rawtext)
rawtext <- gsub("wont", "will not", rawtext)
rawtext <- gsub("?ll", " will", rawtext)
rawtext <- gsub("can?t", "can not", rawtext)
rawtext <- gsub("cant", "can not", rawtext)
rawtext <- gsub("didn?t", "did not", rawtext)
rawtext <- gsub("didnt", "did not", rawtext)
rawtext <- gsub("?re", " are", rawtext)
rawtext <- gsub("?ve", " have", rawtext)
rawtext <- gsub("?d", " would", rawtext)
rawtext <- gsub("?m", " am", rawtext)
rawtext <- gsub("?s", "", rawtext)
# Remove non-alphanumeric characters.
rawtext <- gsub("[^a-zA-Z0-9 ]", " ", rawtext)
# Convert all text to lower case.
rawtext <- tolower(rawtext)
# Stem words
rawtext <- stemDocument(rawtext, language = "english")
return(rawtext)
}
这个小程序我简单介绍一下,第一行就是就是把文字中的"'"全部改成“?”,其他也是差不多的,第二行就是把"n?t"改成" not".接下来gsub("[^a-zA-Z0-9 ]", " ", rawtext)这句前面有个^,表示把没有数据和字母的字符的字符串定义为缺失。tolower(rawtext)是把数据转成小写。
写好程序后咱们运行一下
data$review <- sapply(data$review, cleanText)

这样数据就被清洗一遍了,接下来咱们需要使用tidytext包中的unnest_tokens函数先把评论打散,变成一个个的单词,然后把含有stop的单词去掉,再把每行重复的词去掉,最后选择大于3个字符的词
tidydata <- data %>%
  unnest_tokens(word, review) %>%  #将句子打散变成单个词
  anti_join(stop_words) %>%  #Joining with `by = join_by(word)` remove stop words
  distinct() %>%   #去除重复
  filter(nchar(word) > 3)
我们看下整理后的数据,我们可以看到同一行被拆成多个词,当然数据也比原来大了很多

接下来咱们需要使用get_sentiments函数来对文本进行分析,它自带有很多字典咱们这次使用"bing"字典进行分析,咱们先来看下什么是"bing"字典
head(get_sentiments("bing"),20)

我们可以看到字典就是对应的字符串,假如匹配到abnormal 这个词,函数就会返回负面的negative,假如是abound这个词,函数就会返回正面的positive
tidydata %>%
  inner_join(get_sentiments("bing"))  #使用"bing"的字典进行情感分析

咱们看到数据很大,咱们只取其中的4种药物来分析"Levothyroxine",“Vyvanse”,“Xiidra”,“Oseltamivir”,并且计算出每种药物的评价数量和百分比
drug_polarity <- tidydata %>%
  inner_join(get_sentiments("bing")) %>%   #使用"bing"的字典进行情感分析
  filter(drugName == "Levothyroxine" |     #选定4种药物
           drugName == "Vyvanse" |
           drugName == "Xiidra" |
           drugName == "Oseltamivir") %>%
  count(sentiment, drugName) %>%           #对情感进行计数
  pivot_wider(names_from = sentiment,   #选择要访问的列
              values_from = n,           #输出列的名字
              values_fill = 0) %>%       #如果缺失的话默认填0
  mutate(polarity = positive - negative,  #评分
         percent_positive = positive/(positive+negative) * 100) %>%  #计算百分比
  arrange(desc(percent_positive))

上图对显示出患者对药物的一些基本反馈。
下面咱们准备开始进行无监督学习,先要建立矩阵(DTM),
drug_as_doc_dtm <- tidydata %>%
  count(drugName, word, sort = TRUE) %>%  #每种药物的评价词语的个数
  ungroup() %>%
  cast_dtm(drugName, word, n) %>%  #将数据帧转换为tm包中DocumentTermMatrix,TermDocumentMatrix或dfm
  removeSparseTerms(0.995)
我们看一下这个矩阵
inspect(drug_as_doc_dtm)

建立好矩阵后主要是通过topicmodels包的LDA函数来进行无监督学习,这里的K表示你想要分成几组,control这里可以设置一个种子
lda<- LDA(drug_as_doc_dtm, k = 3,
          control = list(seed = 123))
接着咱们对数据进行进一步提取
top_terms_per_topic <- lda %>%
  tidy(matrix = "beta") %>%    #获取系数
  group_by(topic) %>%         #分组
  arrange(topic, desc(beta)) %>%    #排序
  slice(seq_len(10)) # Number of words to display per topic
看下提取后的数据,第一个是组别,第二个是它的名字,第三个是它的beta

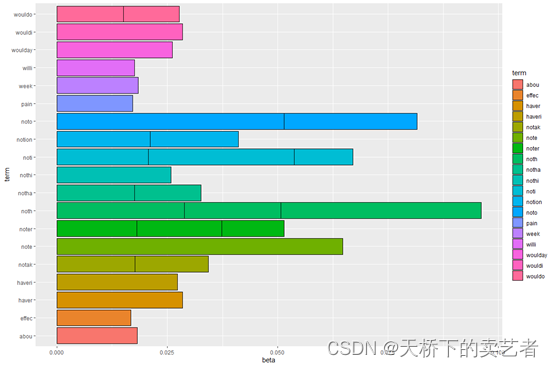
接下来咱们可以做一些简单的可视化,加入咱们想看这些词的几率
ggplot(top_terms_per_topic, aes(x = beta, y = term, fill = term)) +
  geom_bar(stat = "identity", color = "black")

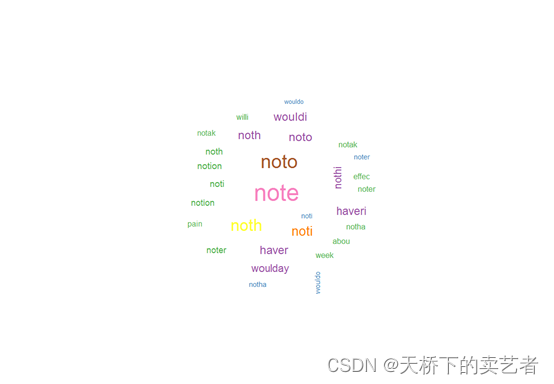
或者做个词云图
library(wordcloud)

wordcloud(top_terms_per_topic$term,top_terms_per_topic$beta,scale=c(3,0.3),min.freq=-Inf,
          max.words=Inf,colors=brewer.pal(8,'Set1'),random.order=F,random.color=F,ordered.colors=F)

本期先介绍到这里,下期继续介绍有监督学习,未完待续。
参考文献:
- tm包文档
- tidytext包文档
- topicmodels包文档
- Harrison, C.J., Sidey-Gibbons, C.J. Machine learning in medicine: a practical introduction to natural language processing. BMC Med Res Methodol 21, 158 (2021).
- https://www.cnblogs.com/jiangxinyang/p/9358339.html
- https://blog.csdn.net/sinat_26917383/article/details/51547298
本文来自互联网用户投稿,该文观点仅代表作者本人,不代表本站立场。本站仅提供信息存储空间服务,不拥有所有权,不承担相关法律责任。 如若内容造成侵权/违法违规/事实不符,请联系我的编程经验分享网邮箱:veading@qq.com进行投诉反馈,一经查实,立即删除!