highcharts的甘特图设置滚动时表头固定,让其他内容跟随滚动
2023-12-27 03:46:21
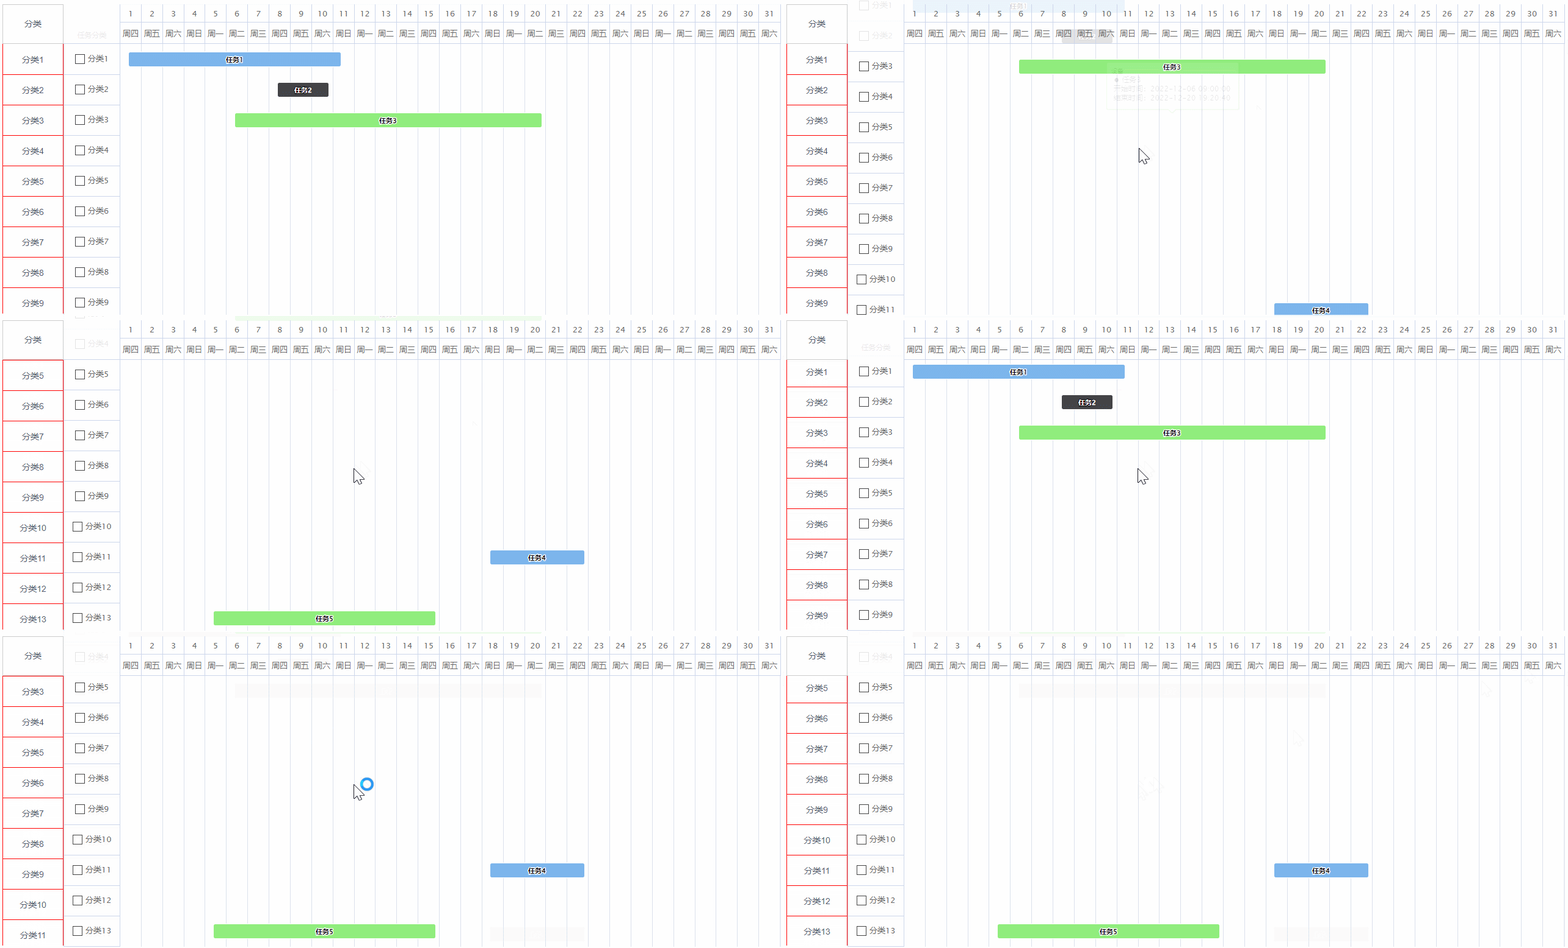
效果图:最左侧的分类列是跟随甘特图滚动的,因为这一列如果需要自定义,比如表格的话可能会存在行合并的情况,这个时候甘特图是没有办法做的,然后甘特图的表头又需要做滚动时固定,所以设置了甘特图滚动时,让指定元素跟随滚动

如果元素需要滚动,但是不显示滚动条的话可以设置
首先,确保目标元素具有固定的高度和宽度,并且超过该尺寸的内容会溢出。
将元素的 CSS 样式中的 overflow 属性设置为 hidden,以隐藏默认的滚动条。
<div style="overflow: hidden"></div>
highcharts监听滚动事件
const chart = Highcharts.chart('container', {
  chart: {
    ...
    },
    ...
  },
  ...
});
chart.scrollingContainer.addEventListener('scroll', (el) => {
    console.log(el);
});
引用到的包
highcharts-gantt.js下载地址
需要引入highcharts-gantt.js,moment.js
完整代码示例:
<template>
  <div style="width: 100%; height: 100%; display: flex">
    <div
      style="
        width: 100px;
        display: flex;
        flex-direction: column;
        height: 508px;
        margin: 10px 0 0 10px;
      "
    >
      <div
        style="
          height: 105px;
          border: 1px solid #ccc;
          display: flex;
          align-items: center;
          justify-content: center;
        "
      >
        分类
      </div>
      <!-- 设置指定元素可以滚动但不显示滚动条overflow: hidden -->
      <!-- 高度为length计算出来的高度 -->
      <div style="overflow: hidden; height: 721px" id="areaContainer">
        <div
          v-for="(item, index) in categories"
          style="width: 100px; height: 50px"
          :key="item.id"
        >
          <div
            style="
              width: 100px;
              height: 52px;
              border: 1px solid red;
              display: flex;
              align-items: center;
              justify-content: center;
            "
            :style="{
              'border-bottom':
                index + 1 === categories.length ? '1px solid red' : 'none',
              'border-top': index === 0 ? 'none' : '1px solid red',
            }"
          >
            {{ item.value }}
          </div>
        </div>
      </div>
    </div>
    <!-- 固定x轴设置高度,值比508大一点,范围得自己调 -->
    <div id="container" style="flex: 1; height: 535px"></div>
  </div>
</template>
<script>
import moment from "moment";
import Highcharts from "@/utils/highcharts-gantt";
export default {
  data() {
    return {
      ganttData: [
        {
          name: "任务1",
          x: new Date("2022-12-01 09:00:00").getTime(),
          x2: new Date("2022-12-11 09:00:00").getTime(),
          y: 0,
        },
        {
          name: "任务2",
          x: new Date("2022-12-08 09:00:00").getTime(),
          x2: new Date("2022-12-10 19:20:40").getTime(),
          y: 1,
        },
        {
          name: "任务3",
          x: new Date("2022-12-06 09:00:00").getTime(),
          x2: new Date("2022-12-20 19:20:40").getTime(),
          y: 2,
        },
        {
          name: "任务4",
          x: new Date("2022-12-18 09:00:00").getTime(),
          x2: new Date("2022-12-22 19:20:40").getTime(),
          y: 10,
        },
        {
          name: "任务5",
          x: new Date("2022-12-05 09:00:00").getTime(),
          x2: new Date("2022-12-15 19:20:40").getTime(),
          y: 12,
        },
      ],
      categories: [
        {
          id: 1,
          value: "分类1",
        },
        {
          id: 2,
          value: "分类2",
        },
        {
          id: 3,
          value: "分类3",
        },
        {
          id: 4,
          value: "分类4",
        },
        {
          id: 5,
          value: "分类5",
        },
        {
          id: 6,
          value: "分类6",
        },
        {
          id: 7,
          value: "分类7",
        },
        {
          id: 8,
          value: "分类8",
        },
        {
          id: 9,
          value: "分类9",
        },
        {
          id: 10,
          value: "分类10",
        },
        {
          id: 11,
          value: "分类11",
        },
        {
          id: 12,
          value: "分类12",
        },
        {
          id: 13,
          value: "分类13",
        },
      ],
      areas: [
        {
          id: 11,
          value: "卷包车间",
          // length: 8
        },
        {
          id: 22,
          value: "异型车间",
          // length: 5
        },
        {
          id: 223,
          value: "异型车间1",
          // length: 5
        },
      ],
    };
  },
  mounted() {
    this.categories = this.categories.map((i) => ({
      ...i,
      checked: false,
    }));
    let month = "2022-12";
    const WEEKS = {
      0: "日",
      1: "一",
      2: "二",
      3: "三",
      4: "四",
      5: "五",
      6: "六",
    };
    Highcharts.setOptions({
      global: {
        useUTC: false, // 不使用utc时间
      },
      lang: {
        noData: "暂无数据",
      },
    });
    const gChart = Highcharts.ganttChart("container", {
      alignTicks: false,
      series: [
        {
          type: "gantt",
          name: "设备",
          data: this.ganttData,
          dataLabels: {
            enabled: true,
            format: "{point.name}",
          },
          tooltip: {
            pointFormatter: function () {
              return `<div>
                <span style="color:{point.color}">\u25CF</span> ${this.name}
                <br />
                开始时间:${moment(this.x).format("YYYY-MM-DD HH:mm:ss")}
                <br />
                结束时间:${moment(this.x2).format("YYYY-MM-DD HH:mm:ss")}
              </div>`;
            },
          },
        },
      ],
      xAxis: [
        {
          min: moment(month).valueOf(),
          max: moment(month).endOf("month").valueOf(),
          gridLineEidth: 1,
          minTickInterval: 1000 * 60 * 60 * 24,
          currentDateIndicator: true,
          tickPixelInterval: 70,
          grid: {
            borderWidth: 1, // 右侧表头边框宽度
            cellHeight: 35, // 右侧日期表头高度
          },
          labels: {
            align: "center",
            formatter: function () {
              return `周${WEEKS[moment(this.value).day()]}`;
            },
          },
        },
        {
          gridLineWidth: 1,
          minTickInterval: 1000 * 60 * 60 * 24,
          tickPixelInterval: 100,
          grid: {
            borderWidth: 1, // 右侧表头边框宽度
            cellHeight: 30, // 右侧日期表头高度
          },
          labels: {
            align: "center",
            formatter: function () {
              return `${moment(this.value).format("D")} `;
            },
          },
        },
      ],
      yAxis: {
        type: "category",
        grid: {
          columns: [
            {
              title: {
                text: "任务分类",
              },
              reversed: true,
              categories: this.categories,
              labels: {
                useHTML: true,
                formatter: function () {
                  var label = `
                <div style="display:flex;align-items:center">
                  <div class="checkbox" style="width:16px;height:16px;border:1px solid #444;margin-right:5px;cursor:pointer" id='${this.value.id}'>
                    <span
                      class="has-check"
                      style="opacity: 0;font-size:12px;padding-left:3px;">?</span>
                  </div>
                  ${this.value.value}
                </div>`;
                  return label;
                },
              },
            },
          ],
        },
      },
      chart: {
        spacingLeft: 0,
        scrollablePlotArea: {
          minHeight: 741, // 52 * this.categories.length + 65(52是每个y轴label的高度,65是2个xAxis的高度),设置这个属性能在页面滚动时,头部固定
        },
      },
    });
    let areadiv = document.querySelector("#areaContainer");
    // 监听甘特图的滚动事件
    gChart.scrollingContainer.addEventListener("scroll", (e) => {
      // 给指定元素设置滚动距离
      areadiv.scrollTo({
        top: e.target.scrollTop,
        behavior: "smooth",
      });
    });

    const labelElements = document.querySelectorAll(
      "#container .highcharts-yaxis-labels .checkbox"
    );

    // 自定义复选框,给复选框添加点击事件
    labelElements.forEach((label) => {
      label.addEventListener(
        "click",
        (el) => {
          let element = el.target; // element是.checkbox元素
          const addClickElement = this.getParentElement(element, "checkbox");
          let id = "";
          if (element.classList.toString().indexOf("checkbox") !== -1) {
            id = element.getAttribute("id");
          }
          if (addClickElement) {
            id = addClickElement.getAttribute("id");
            element = addClickElement;
          }
          this.categories[id - 1].checked = !this.categories[id - 1].checked;
          element.style.background = this.categories[id - 1].checked
            ? "#0061ff"
            : "none";
          element.style.borderColor = this.categories[id - 1].checked
            ? "#0061ff"
            : "#444";
          element.querySelector(".has-check").style.opacity = 1;
          element.querySelector(".has-check").style.color = "#fff";
        },
        true
      );
    });

    // 监听鼠标滚轮事件
    // document.querySelector('#container').addEventListener('wheel', (el) => {
    //   console.log(el)
    // })
  },
  methods: {
    // 根据当前target元素找到指定className的父元素
    getParentElement(target, className) {
      let parent = target.parentElement;
      while (parent) {
        if (parent.classList.toString().indexOf(className) !== -1) {
          return parent;
        }
        parent = parent.parentElement;
      }
      return null;
    },
  },
};
</script>
文章来源:https://blog.csdn.net/qq_38157825/article/details/135225525
本文来自互联网用户投稿,该文观点仅代表作者本人,不代表本站立场。本站仅提供信息存储空间服务,不拥有所有权,不承担相关法律责任。 如若内容造成侵权/违法违规/事实不符,请联系我的编程经验分享网邮箱:veading@qq.com进行投诉反馈,一经查实,立即删除!
本文来自互联网用户投稿,该文观点仅代表作者本人,不代表本站立场。本站仅提供信息存储空间服务,不拥有所有权,不承担相关法律责任。 如若内容造成侵权/违法违规/事实不符,请联系我的编程经验分享网邮箱:veading@qq.com进行投诉反馈,一经查实,立即删除!