echarts图之 底部滚动横轴 缩放图形大小
2023-12-13 21:02:45
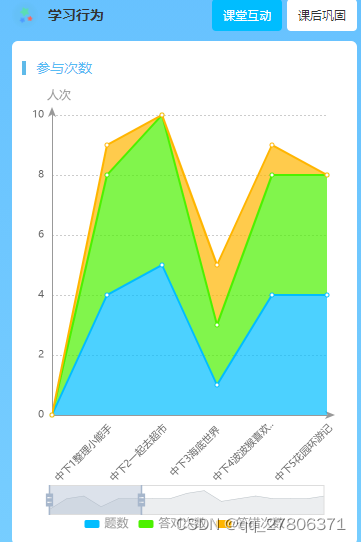
    //折线图-堆叠面积图
	function pileLineChart(odata, dom){
        //放大缩小的代码start
		var dataZoom = [],y2=40;
		if(odata.xData.length > 7){
			dataZoom = [
                {
                    show: true,
                    realtime: true,
                    startValue:0,
                    endValue:5,
                    left:"center",
                    top:"auto",
                    right:"auto",
                    bottom:20,
                },
                {
                    type: 'inside',
                    realtime: true,
                    startValue:0,
                    endValue:5,
                }
            ]
			y2 = 78;
		}else{
			dataZoom = [];
			y2 = 40;
		}
        //放大缩小的代码end-下面还有

		var myChart = echarts.init(document.getElementById(dom));
		//console.log(odata)
		let oarr = []
		oarr = odata.series.map(function(item){
			var data = [];
			data.push(0);
			for (var i = 0 ; i < item.data.length; i++) {
				data.push(item.data[i]);
		    }
			return {
				name: item.name,
		      	type: 'line',
		      	stack: 'Total',
		      	barMinHeight: 0, //最小柱高
              	barWidth: 14, // 柱宽度
              	barMaxWidth: 100,// 最大柱宽度
		      	areaStyle: {},
		      	emphasis: {
		        	focus: 'series'
		      	},
		      	data: data
			}
		})
		var xData = [];
		xData.push('');
		for (var i = 0 ; i < odata.xData.length; i++) {
			xData.push(odata.xData[i]);
		}
		option = {
			tooltip: {
		    	trigger: 'axis',
		    	formatter: function(params) {//防止0点被点击
		        	let relVal = ''
		            for (var prop in params) {
		            	if(params[prop].dataIndex == 0) {
		            		relVal = ''
		            	}else{
		            		relVal +=
				            	params[prop].marker +
				                params[prop].seriesName +
				                ' : ' +
				                params[prop].value +
				                '<br/>';
		            	}
		            }
		        	return relVal;
		        },
		  	},
			title: {
			    text: '人次',
			    left: '20',
			    textStyle:{
			    	color: '#999',
			    	fontSize: 12,
			    	fontWeight: 400
			   	}
			},
			color: ['#00bdff', '#4cf100', '#ffb500', '#e83928'],
		  	grid: {
		  		top: '30',
		    	left: '30',
		    	right: '20',
		    	bottom: '120',
		    	containLabel: false
		  	},
		  	dataZoom: dataZoom,//放大缩小的引用
		  	legend: {
              	itemWidth:15,
              	itemHeight:15,
              	data: barChart.legendData,
              	icon: 'roundRect',
              	itemHeight: 8,
              	textStyle: { //图例文字的样式
                    color: '#999',
                    fontSize: 12
                },
                left: 'center',
                bottom: 'bottom',
          	},
		  	xAxis: [
		  		{
		      		type: 'category',
		      		boundaryGap: false,
		      		data: xData,
		      		nameTextStyle: {
		                color: '#666', //x轴名称颜色
		                fontSize: 10 //x轴名称字体大小
		            },
		            axisLabel: {
		                color: '#666', //x轴刻度标签颜色
		                rotate: 45,
		                fontSize: 10, //y轴名称字体大小
		                formatter: function (params){
		                	return filterFormatter(params)
		                }
		            },
		            axisTick: {
		                show: false //不显示刻度线
		            },
		            axisLine: {
	                    lineStyle: {
	                        color: '#999',
	                        width: 1, //这里是为了突出显示加上的
	                    },
	                    symbol: ['none', 'arrow'],    //只在末端显示箭头
	                    symbolSize: [6, 10],//原来是[8, 16]
	                    symbolOffset:[0, 8],//箭头段移动8个像素
	                },
		    	}
		  	],
		  	yAxis: [
		    	{
		      		type: 'value',
		      		nameTextStyle: {
		                color: '#666', //y轴名称颜色
		                fontSize: 10 //y轴名称字体大小
		            },
		            axisLabel: {
		                color: '#666', //y轴刻度标签颜色
		                fontSize: 10 //y轴名称字体大小
		            },
		            axisTick: {
		                show: false //不显示刻度线
		            },
		            axisLine: {
	                    lineStyle: {
	                        color: '#999',
	                        width: 1, //这里是为了突出显示加上的
	                    },
	                    symbol: ['none', 'arrow'],    //只在末端显示箭头
	                    symbolSize: [6, 10],//原来是[8, 16]
	                    symbolOffset:[0, 8],//箭头段移动8个像素
	                },
	                splitLine: {
		                //网格线
		                lineStyle: {
		                  type: "dotted", //设置网格线类型 dotted:虚线   solid:实线
		                },
		                show: true, //隐藏或显示
		            },
		    	}
		  	],
		  	series: oarr
		}
		myChart.setOption(option, true);
	}

    //字数为8个超出就显示成点
    function filterFormatter(params){
		var index = 8;
	    var newstr = '';
	    for(var i = 0; i< params.length; i += index){
	        var tmp = params.substring(i, i+index);
	        newstr += tmp +'';
	    }
	    if( newstr.length > 8)
	        return newstr.substring(0, 8) + '..';
	    else
	        return '\n'+newstr;
	}
文章来源:https://blog.csdn.net/qq_27806371/article/details/134854778
本文来自互联网用户投稿,该文观点仅代表作者本人,不代表本站立场。本站仅提供信息存储空间服务,不拥有所有权,不承担相关法律责任。 如若内容造成侵权/违法违规/事实不符,请联系我的编程经验分享网邮箱:veading@qq.com进行投诉反馈,一经查实,立即删除!
本文来自互联网用户投稿,该文观点仅代表作者本人,不代表本站立场。本站仅提供信息存储空间服务,不拥有所有权,不承担相关法律责任。 如若内容造成侵权/违法违规/事实不符,请联系我的编程经验分享网邮箱:veading@qq.com进行投诉反馈,一经查实,立即删除!