跟着我学Python进阶篇:01.试用Python完成一些简单问题
往期文章
跟着我学Python基础篇:01.初露端倪
跟着我学Python基础篇:02.数字与字符串编程
跟着我学Python基础篇:03.选择结构
跟着我学Python基础篇:04.循环
跟着我学Python基础篇:05.函数
跟着我学Python基础篇:06.列表
跟着我学Python基础篇:07.文本
跟着我学Python基础篇:08.集合和字典
目录
前言
在基础篇,我们已经掌握了Python中的一些基础的语法规则,那么在进阶篇中,我们将在更深度一些的层次上,去学习和了解Python。
1. 图形:简单绘图
matplotlib是一个用于创建高质量图形的Python库。它可以用于绘制各种类型的图形,包括线图、散点图、条形图、直方图、饼图等。matplotlib提供了丰富的图形定制选项,允许用户自定义各种元素,如标签、标题、轴标签、颜色、线型等。此外,matplotlib还可以与numpy、pandas等其他Python库一起使用,以便更轻松地处理和可视化数据。
1.1 创建窗口
import matplotlib.pyplot as plt

# 创建一个图形窗口
fig = plt.figure()

# 可选:设置窗口的大小和标题
fig.set_size_inches(6, 4)  # 设置窗口大小为6x4英寸
fig.suptitle('My Window')  # 设置窗口标题


# 显示窗口
plt.show()
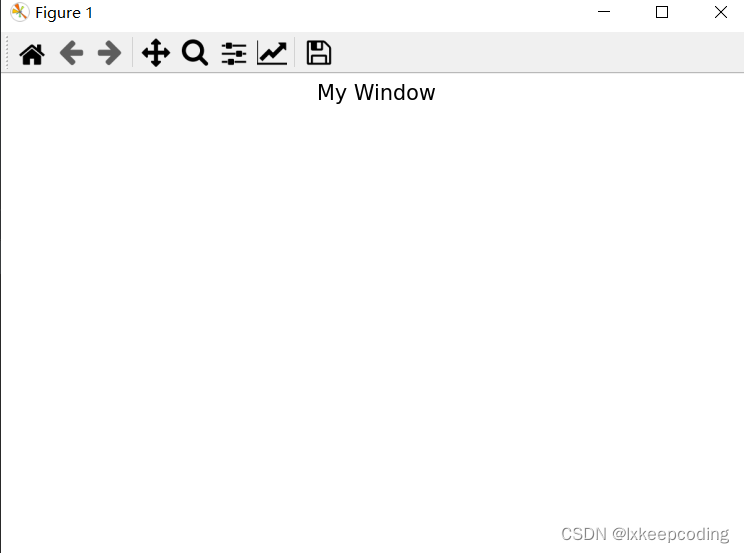
我们首先使用plt.figure()创建了一个图形窗口对象fig。然后,我们可以使用fig.set_size_inches()和fig.suptitle()来设置窗口的大小和标题。
1.2 线和多边形
import matplotlib.pyplot as plt

# 创建一个图形窗口
fig = plt.figure()

# 可选:设置窗口的大小和标题
fig.set_size_inches(6, 4)  # 设置窗口大小为6x4英寸
fig.suptitle('My Window')  # 设置窗口标题

# 绘制折线图
x = [1, 2, 3, 4, 5]
y = [5, 4, 3, 2, 1]
plt.plot(x, y)

# 显示窗口
plt.show()
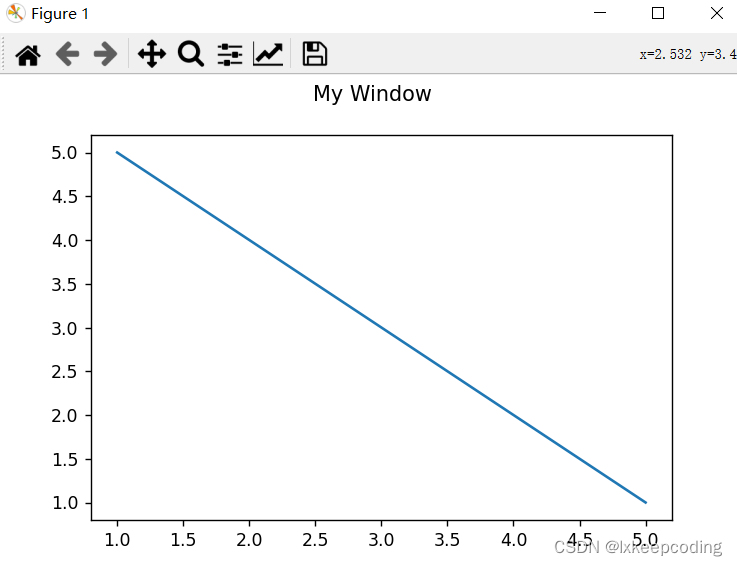
我们首先创建了一个图形窗口,并设置了窗口的大小和标题。然后使用plt.plot()函数绘制了一个折线图,最后使用plt.show()函数显示图形窗口。你可以根据需要在窗口中绘制不同类型的图形。
import matplotlib.pyplot as plt

# 数据
x = ['A', 'B', 'C', 'D']
y = [10, 15, 7, 12]

# 创建一个图形窗口
fig = plt.figure()

# 绘制柱状图
plt.bar(x, y)

# 显示图形
plt.show()
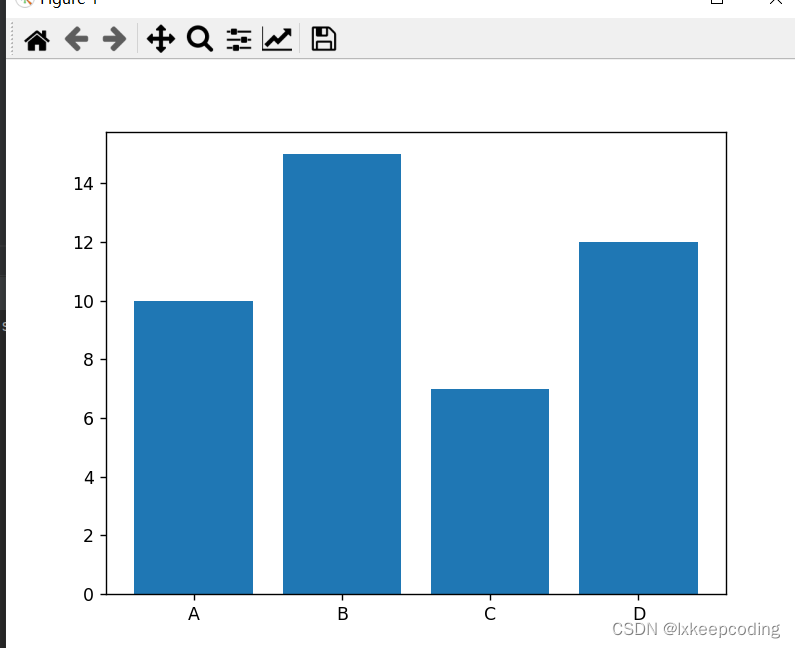
我们定义了两个列表x和y,分别表示柱状图的横轴和纵轴数据。然后创建一个图形窗口,使用plt.bar()函数绘制柱状图。最后使用plt.show()函数显示图形窗口。
import matplotlib.pyplot as plt

# 数据
x = ['A', 'B', 'C', 'D']
y = [10, 15, 7, 12]

# 颜色
colors = ['red', 'green', 'blue', 'orange']

# 创建一个图形窗口
fig = plt.figure()

# 绘制柱状图并填充颜色
plt.bar(x, y, color=colors)

# 显示图形
plt.show()
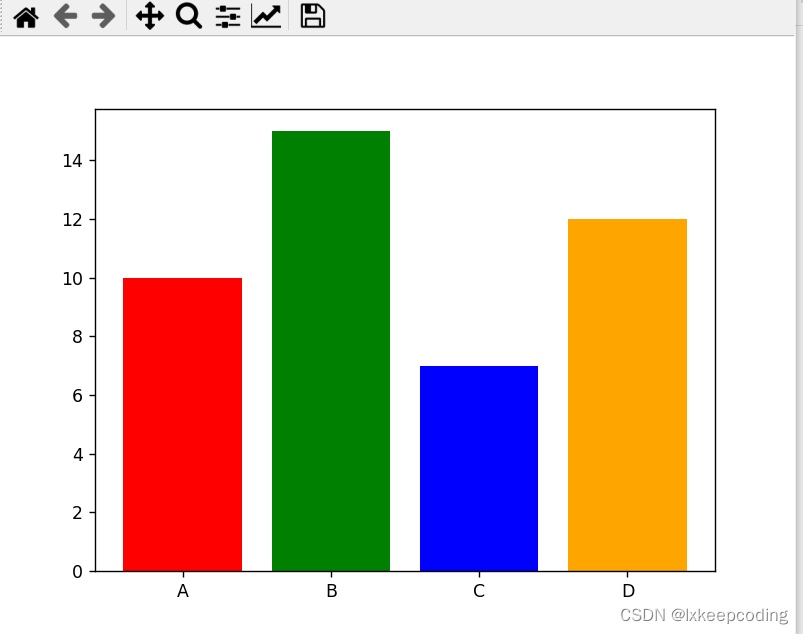
定义了一个colors列表,其中每个元素对应柱状图中每个柱子的颜色。然后创建一个图形窗口,使用plt.bar()函数绘制柱状图,并通过color参数指定填充颜色。最后使用plt.show()函数显示图形窗口。你可以根据实际需求调整x、y和colors的值,以及使用其他参数来自定义柱状图的样式,如宽度、边框颜色等。
2. 使用Sympy进行符号处理
sympy包提供了大量的函数可以计算更多公式的值,包括微积分。让我们来感受一下。
2.1 操作表达式
2.1.1化简表达式
`Sympy可以将表达式自动化简为最简形式。以下是一个例子:
import sympy

# 定义符号变量x和y
x, y = sympy.symbols('x y')

# 定义表达式
expr = 2*x + x - x**2

# 化简表达式
simplified_expr = sympy.simplify(expr)

# 输出化简后的表达式
print(simplified_expr)
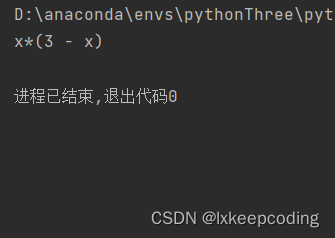
在这个例子中,我们定义了一个表达式2*x + x - x**2,使用sympy.simplify()函数将其化简为最简形式,并将结果存储在变量simplified_expr中。最后,我们使用print()函数输出化简后的表达式。
2.1.2 展开表达式
Sympy可以将表达式展开为多项式。以下是一个例子:
import sympy

# 定义符号变量x和y
x, y = sympy.symbols('x y')

# 定义表达式
expr = (x + y)**2

# 展开表达式
expanded_expr = sympy.expand(expr)

# 输出展开后的表达式
print(expanded_expr)
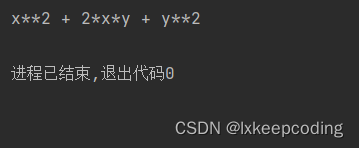
在这个例子中,我们定义了一个表达式(x + y)**2,使用sympy.expand()函数将其展开为多项式,并将结果存储在变量expanded_expr中。最后,我们使用print()函数输出展开后的表达式。
2.1.3 因式分解表达式
将表达式因式分解为乘积形式。以下是一个例子:
import sympy

# 定义符号变量x和y
x, y = sympy.symbols('x y')

# 定义表达式
expr = x**2 - y**2

# 因式分解表达式
factored_expr = sympy.factor(expr)

# 输出因式分解后的表达式
print(factored_expr)

在这个例子中,我们定义了一个表达式x2 - y2,使用sympy.factor()函数将其因式分解为x + y)*(x - y)的乘积形式,并将结果存储在变量actored_expr中。最后,我们使用print()函数输出因式分解后的表达式。
2.1.4 求导数
Sympy可以对表达式求导数。以下是一个例子:
import sympy

# 定义符号变量x和y
x, y = sympy.symbols('x y')

# 定义表达式
expr = x**3 + 2*x**2 + x

# 对表达式求导
derivative_expr = sympy.diff(expr, x)

# 输出求导后的表达式
print(derivative_expr)
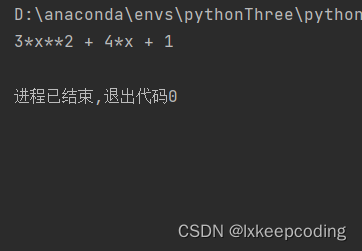
在这个例子中,我们定义了一个表达式x3 + 2*x2 + x,使用sympy.diff()函数对其求导,并将结果存储在变量derivative_expr中。最后,我们使用print()函数输出求导后的表达式。
2.1.5 求积分
import sympy

# 定义符号变量x和y
x, y = sympy.symbols('x y')

# 定义表达式
expr = x**3 + 2*x**2 + x

# 对表达式求积分
integral_expr = sympy.integrate(expr, x)

# 输出求积分后的表达式
print(integral_expr)
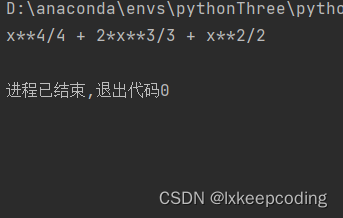
在这个例子中,我们定义了一个表达式x3 + 2*x2 + x,使用sympy.integrate()函数对其求积分,并将结果存储在变量integral_expr中。最后,我们使用print()函数输出求积分后的表达式。
2.2 求解方程
2.2.1 求解一元方程
import sympy

# 定义符号变量x
x = sympy.symbols('x')

# 定义方程
equation = sympy.Eq(x**2 - 4, 0)

# 求解方程
solutions = sympy.solve(equation, x)

# 输出方程的解
print(solutions)
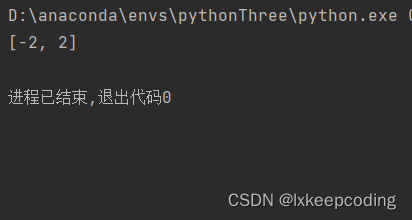
我们定义了一个一元方程x**2 - 4 = 0,使用sympy.solve()函数来求解方程,并将结果存储在变量solutions中。最后,我们使用print()函数输出方程的解。
2.2.2求解多元方程
import sympy

# 定义符号变量x和y
x, y = sympy.symbols('x y')

# 定义方程组
equations = [
    sympy.Eq(x + y, 5),
    sympy.Eq(2*x - y, 1)
]

# 求解方程组
solutions = sympy.solve(equations, (x, y))

# 输出方程组的解
print(solutions)

我们定义了一个多元方程组,包含两个方程x + y = 5和2*x - y = 1。我们使用sympy.solve()函数来求解方程组,并将结果存储在变量solutions中。最后,我们使用print()函数输出方程组的解。
2.2.3 求解高阶多项方程
import sympy

# 定义符号变量x
x = sympy.symbols('x')

# 定义高阶多项式方程
equation = x**4 - 6*x**3 + 11*x**2 - 6*x

# 求解方程
solutions = sympy.solve(equation, x)

# 输出方程的解
print(solutions)
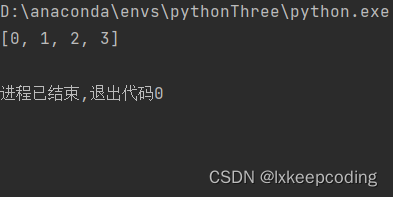
高阶多项式方程x4 - 6*x3 + 11x**2 - 6x,使用sympy.solve()函数求解方程,并将结果存储在变量solutions中。最后,我们使用print()函数输出方程的解。
2.2.4 求解三角方程
import sympy

# 定义符号变量x
x = sympy.symbols('x')

# 定义三角方程
equation = sympy.sin(x) - sympy.cos(x)

# 求解方程
solutions = sympy.solve(equation, x)

# 输出方程的解
print(solutions)
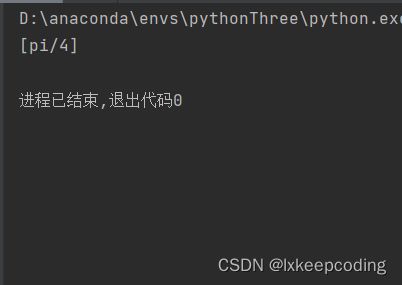
我们定义了一个三角方程sin(x) - cos(x),使用sympy.solve()函数求解方程,并将结果存储在变量solutions中。最后,我们使用print()函数输出方程的解。
2.2.5 求解指数方程
import sympy

# 定义符号变量x
x = sympy.symbols('x')

# 定义指数方程
equation = sympy.exp(x) - 2**x

# 求解方程
solutions = sympy.solve(equation, x)

# 输出方程的解
print(solutions)
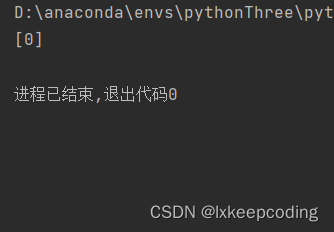
2.3 画函数图像
import sympy
from sympy.plotting import plot

# 定义符号变量x
x = sympy.symbols('x')

# 定义函数
f = x**2

# 绘制函数图像
p = plot(f, (x, -5, 5), show=False)

# 设置标题和坐标轴标签
p.title = 'Function Graph'
p.xlabel = 'x'
p.ylabel = 'y'

# 显示图像
p.show()
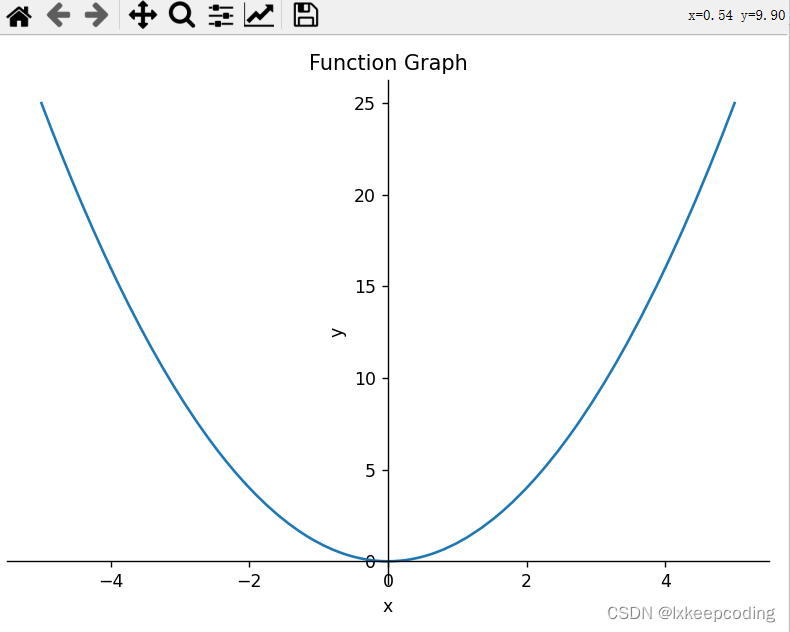
我们定义了一个函数f(x) = x**2,使用sympy库的plot()函数来绘制函数的图像。第一个参数是要绘制的函数,第二个参数是函数自变量的范围。plot()函数还有许多其他参数可以用来定制图像,例如线条颜色、线条样式等。
最后,我们设置了标题和坐标轴标签,并使用show()函数显示图像。
注意,sympy库的绘图功能相对于专业的绘图库可能较为简单,因此对于绘制复杂的图像,建议使用更专业的绘图库,例如matplotlib。
3. 随机数的生成和模拟
3.1 模拟掷骰子
import pygame
import sys
import random
import time

pygame.init()

WINDOW_SIZE = (400, 400)
screen = pygame.display.set_mode(WINDOW_SIZE)
pygame.display.set_caption("Rolling Dice Animation")

DICE_POINTS = {
    1: [(200, 200)],
    2: [(170, 170), (230, 230)],
    3: [(170, 170), (200, 200), (230, 230)],
    4: [(170, 170), (230, 230), (170, 230), (230, 170)],
    5: [(170, 170), (230, 230), (170, 230), (230, 170), (200, 200)],
    6: [(170, 170), (230, 230), (170, 230), (230, 170), (170, 200), (230, 200)],
}

def draw_dice(number):
    screen.fill((255, 255, 255))

    pygame.draw.rect(screen, (0, 0, 0), (150, 150, 100, 100))

    for point in DICE_POINTS[number]:
        pygame.draw.circle(screen, (255, 0, 0), point, 10)

    pygame.display.flip()

def roll_dice_animation():
    current_number = 1

    for _ in range(30):
        draw_dice(current_number)
        current_number = random.randint(1, 6)
        time.sleep(0.1)

    return current_number

def main():
    while True:
        for event in pygame.event.get():
            if event.type == pygame.QUIT:
                pygame.quit()
                sys.exit()

        result = roll_dice_animation()
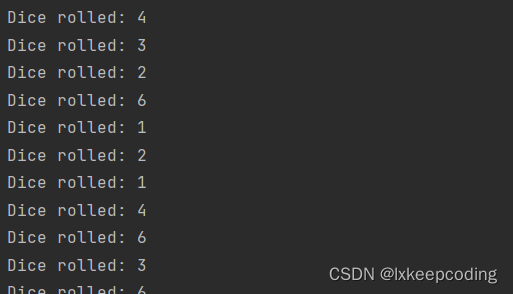
        print(f"Dice rolled: {result}")
        time.sleep(1)  # 停留一秒,显示掷出的点数

if __name__ == "__main__":
    main()

3.2 模拟打靶
import pygame
import sys
import random

pygame.init()

WINDOW_SIZE = (400, 400)
screen = pygame.display.set_mode(WINDOW_SIZE)
pygame.display.set_caption("Target Shooting Simulation")

TARGET_RADIUS = 50  # 调整靶子半径
TARGET_COLOR = (255, 0, 0)
BACKGROUND_COLOR = (255, 255, 255)

shots = []

def draw_target():
    pygame.draw.circle(screen, TARGET_COLOR, (200, 200), TARGET_RADIUS)

def draw_shots():
    for shot in shots:
        pygame.draw.circle(screen, (0, 255, 0), shot[0], 5)
        font = pygame.font.Font(None, 36)
        text = font.render(str(shot[1]), True, (0, 255, 0))
        screen.blit(text, (shot[0][0] - 10, shot[0][1] - 20))

def calculate_score(distance):
    max_distance = TARGET_RADIUS
    min_distance = 0
    normalized_distance = max(0, min((max_distance - distance) / max_distance, 1))
    score = int(normalized_distance * 10)
    return score

def main():
    clock = pygame.time.Clock()

    while True:
        for event in pygame.event.get():
            if event.type == pygame.QUIT:
                pygame.quit()
                sys.exit()
            elif event.type == pygame.MOUSEBUTTONDOWN and event.button == 1:  # 左键点击
                mouse_x, mouse_y = pygame.mouse.get_pos()
                distance = ((mouse_x - 200) ** 2 + (mouse_y - 200) ** 2) ** 0.5
                if distance <= TARGET_RADIUS:
                    score = calculate_score(distance)
                    print(f"Hit! Score: {score}")
                    shots.append(((mouse_x, mouse_y), score))

        screen.fill(BACKGROUND_COLOR)
        draw_target()
        draw_shots()

        pygame.display.flip()
        clock.tick(60)

if __name__ == "__main__":
    main()

3.3 生成随机密码
import random
import string

def generate_password(length=12):
    characters = string.ascii_letters + string.digits + string.punctuation
    password = ''.join(random.choice(characters) for _ in range(length))
    return password

# 生成一个默认长度为12的密码
password = generate_password()
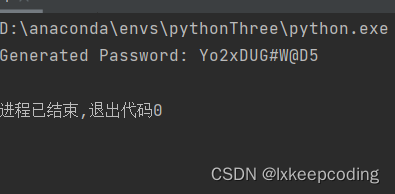
print("Generated Password:", password)
本文来自互联网用户投稿,该文观点仅代表作者本人,不代表本站立场。本站仅提供信息存储空间服务,不拥有所有权,不承担相关法律责任。 如若内容造成侵权/违法违规/事实不符,请联系我的编程经验分享网邮箱:veading@qq.com进行投诉反馈,一经查实,立即删除!